The actionable contribution

Actionable Model

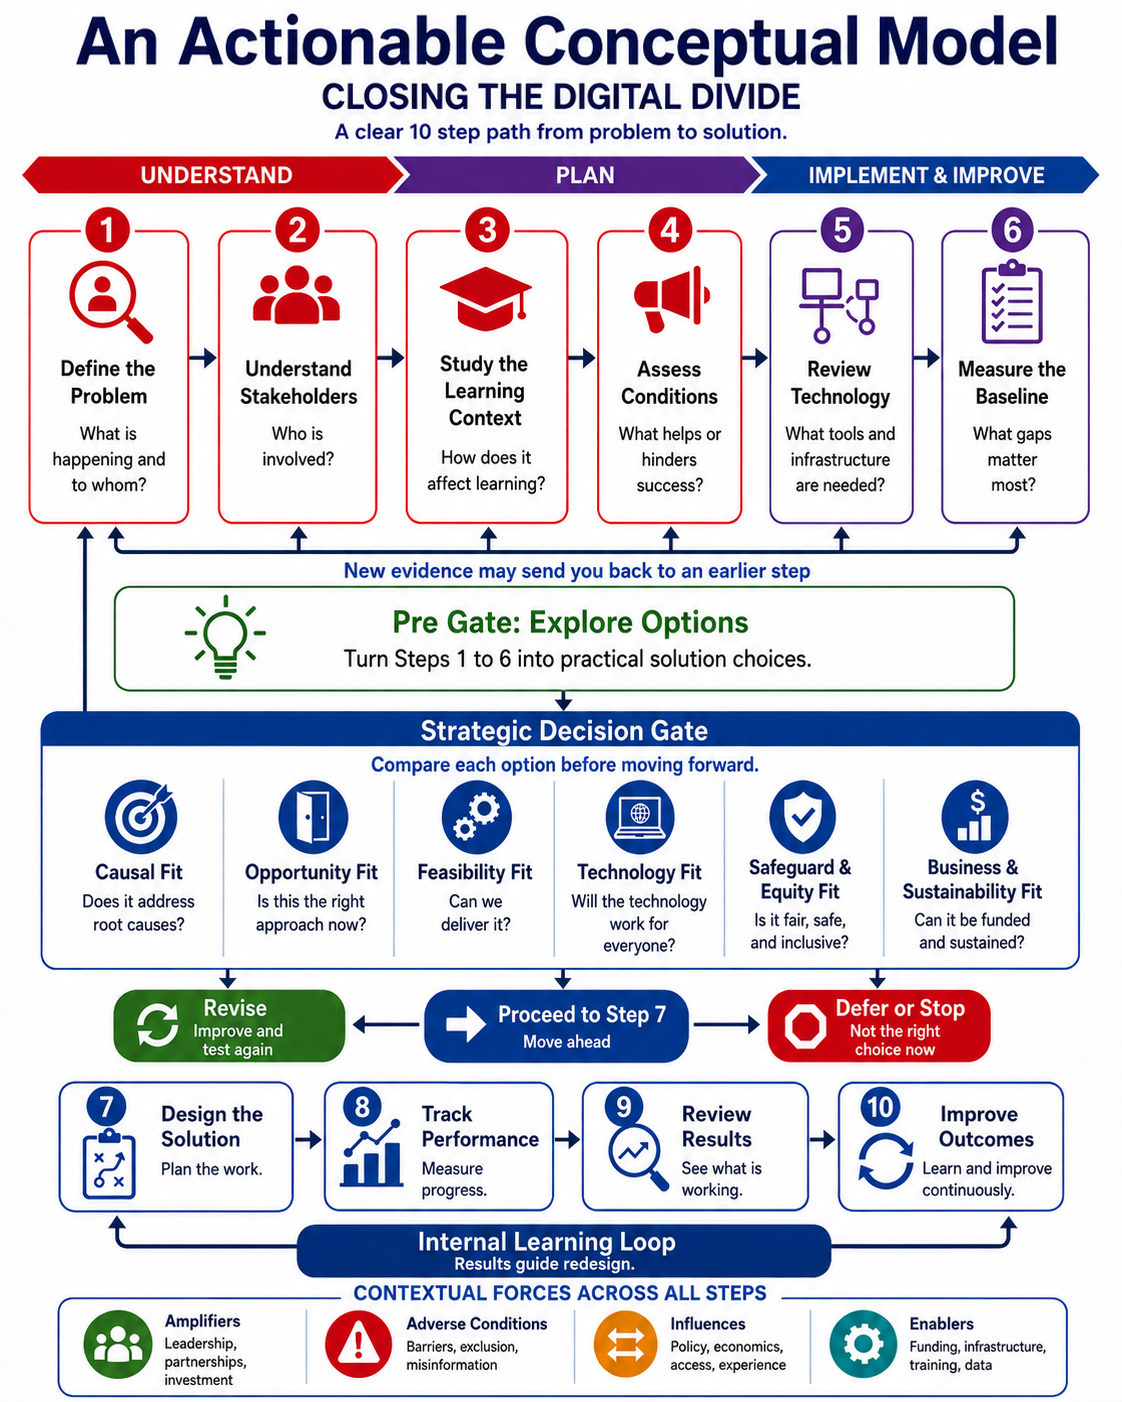
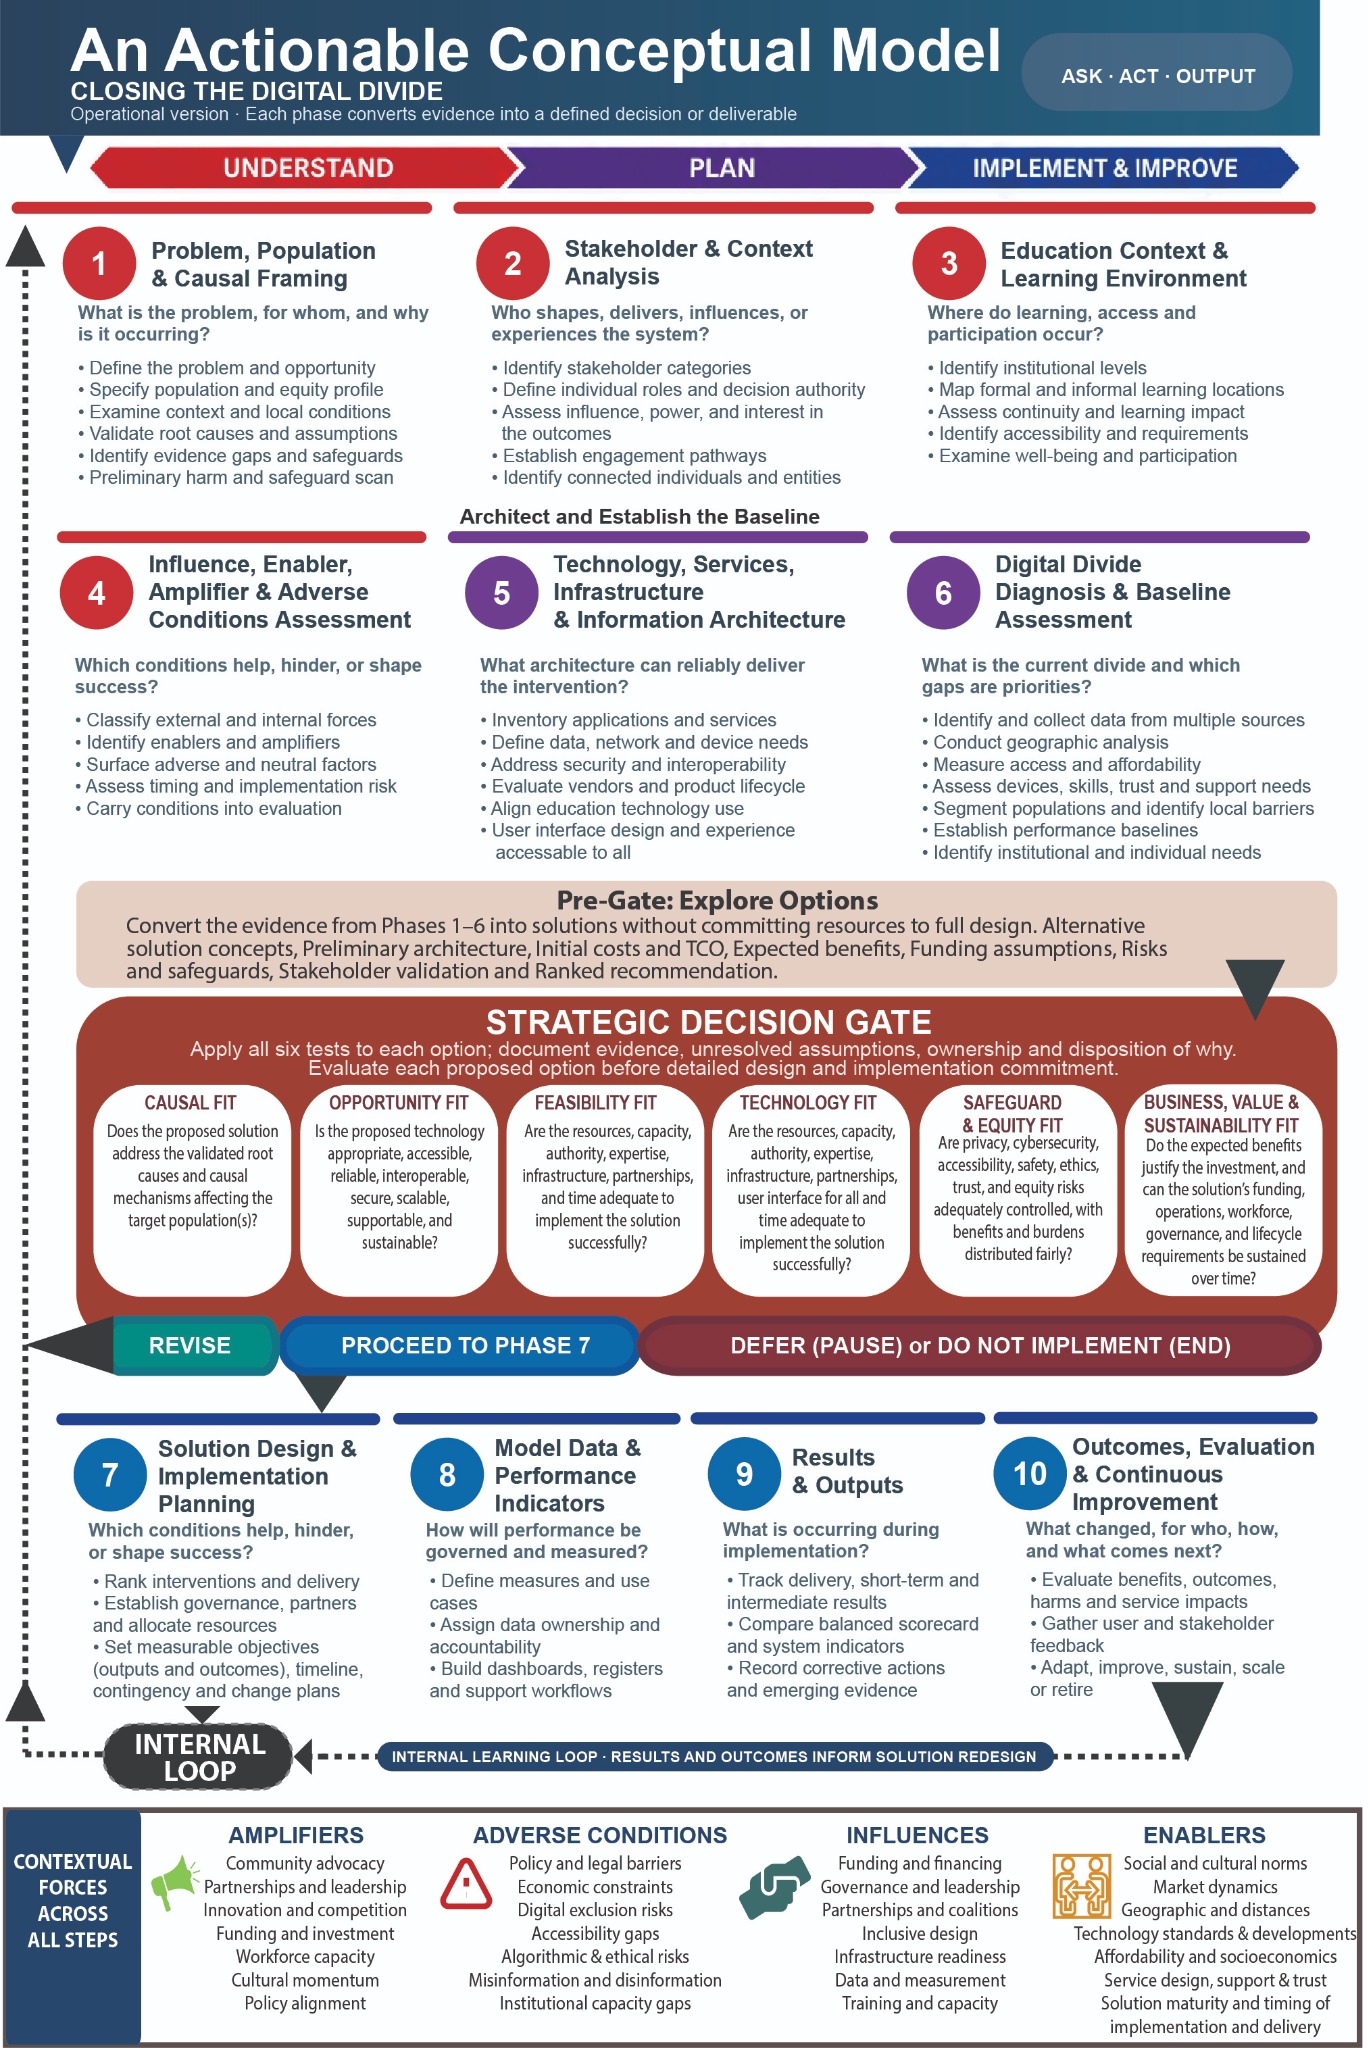
The model guides practitioners through context, stakeholders, education, conditions, architecture, diagnosis, option analysis, a strategic gate, implementation, measurement, results, and continuous learning.

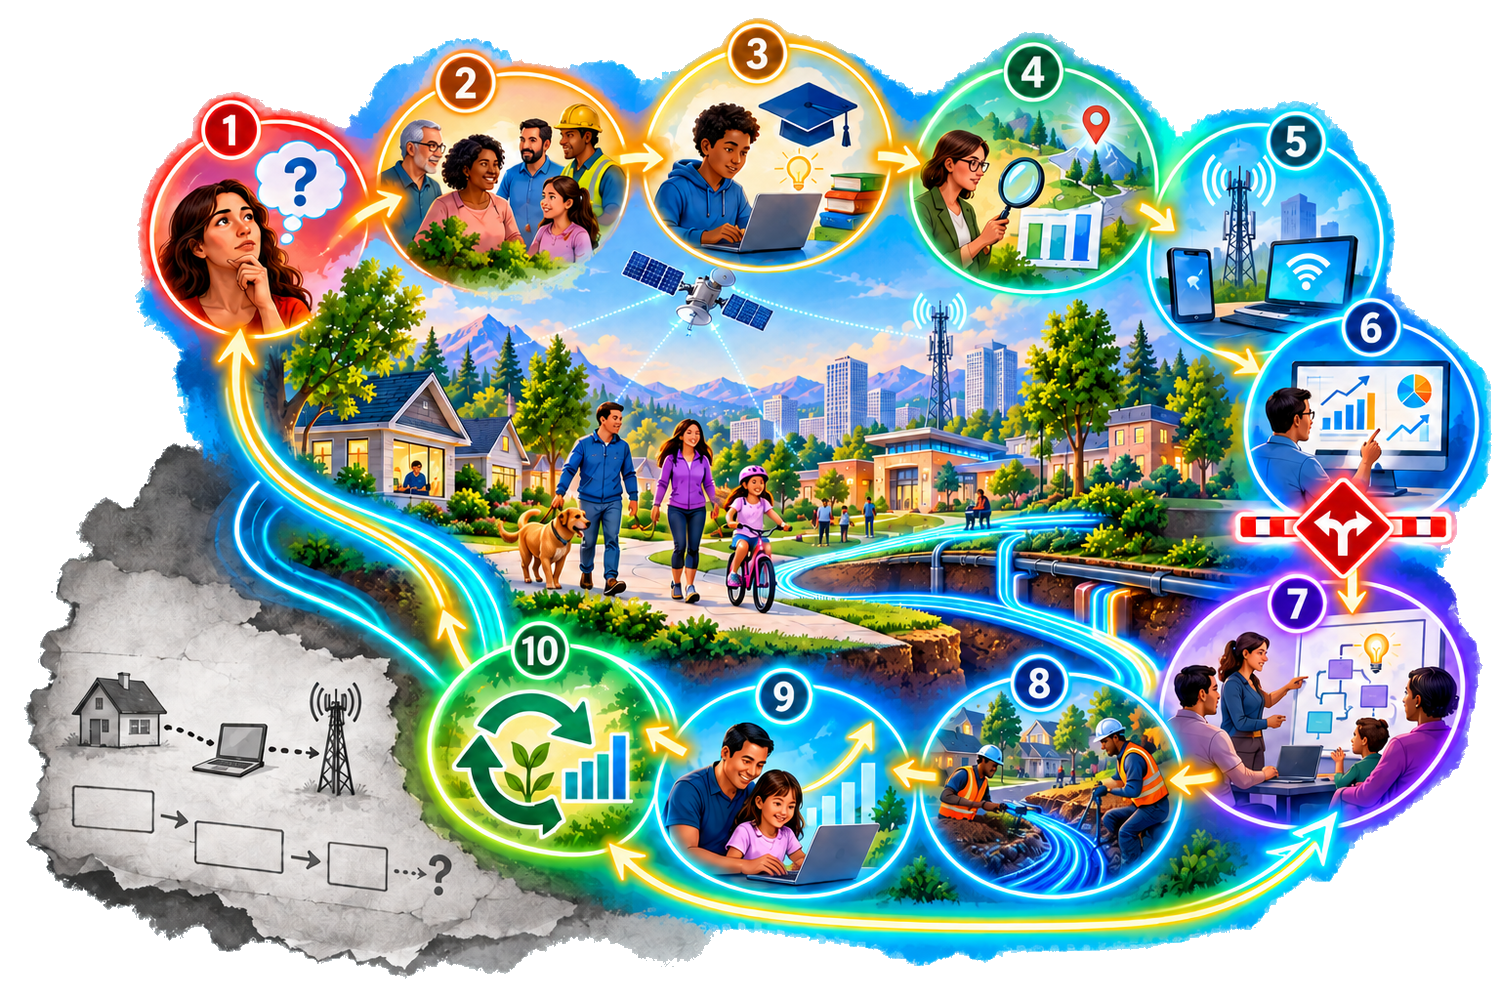
A sparse black-and-white traditional digital-divide model is overtaken by a vivid ten-stage systems model connecting people, education, infrastructure, evidence, a strategic decision gate, implementation, measurement, outcomes, and continuous learning.

How to read the model

One architecture, two levels of detail.

The model is a grounded-theory-informed framework for explanation and action. It connects causal diagnosis, stakeholders, educational context, technology architecture, evidence, decision-making, implementation, measurement, outcomes, and improvement as one system.

The overview shows the journey at a glance. The detailed version turns that same architecture into a working framework of questions, evidence requirements, safeguards, governance activities, and measurement responsibilities.

Strategic view Overview version of the complete Actionable Conceptual Model
Overview model. Use this view to explain the ten-phase architecture, the central decision gate, and the feedback loops to academic, executive, and community audiences.
Operational view Operational version of the complete Actionable Conceptual Model
Detailed model. Use this view in planning, governance, program design, and implementation review when the work requires explicit evidence and responsibilities.

The story of the pathway

Diagnose before deciding. Govern before delivering. Learn before scaling.

Phases 1–6 establish what is happening, who is affected, why exclusion persists, and what conditions shape the response. The Strategic Decision Gate then tests whether an option addresses the validated cause and can be delivered responsibly. Phases 7–10 convert an approved option into governed action, observable evidence, meaningful outcomes, and renewed learning.

The sequence is disciplined but not rigid. Internal and external feedback loops return new evidence to earlier phases whenever assumptions change, barriers remain, or implementation reveals a better course.

Chapter I · Understand

Build the evidence before choosing the intervention.

The first six phases resist the temptation to begin with a technology, funding stream, or favored program. Together they establish the causal, human, institutional, educational, contextual, technical, and measurable foundation for a defensible decision.

Phase 1 · Frame

Problem, population, and causal framing

What is the problem, for whom, and why is it occurring?

Define the opportunity, target population, equity profile, context, root causes, evidence gaps, and preliminary safeguards before proposing an intervention.

Why this phase comes first

A problem cannot be described adequately without identifying who experiences it, and a population cannot be served responsibly without examining the mechanisms that produce or sustain inequity. Beginning with an available technology or funding category can address a visible symptom while leaving the actual cause unchanged.

What practitioners examine

The phase tests whether exclusion arises from connectivity, affordability, devices, accessibility, skills, institutional support, trust, language, service design, policy, or interacting conditions. Evidence is separated from assumptions and gaps, while potential harms and safeguards are identified early enough to influence every later decision.

Produces
Problem statement, population profile, causal map, evidence register.
Discipline
Separate visible symptoms from underlying causes.
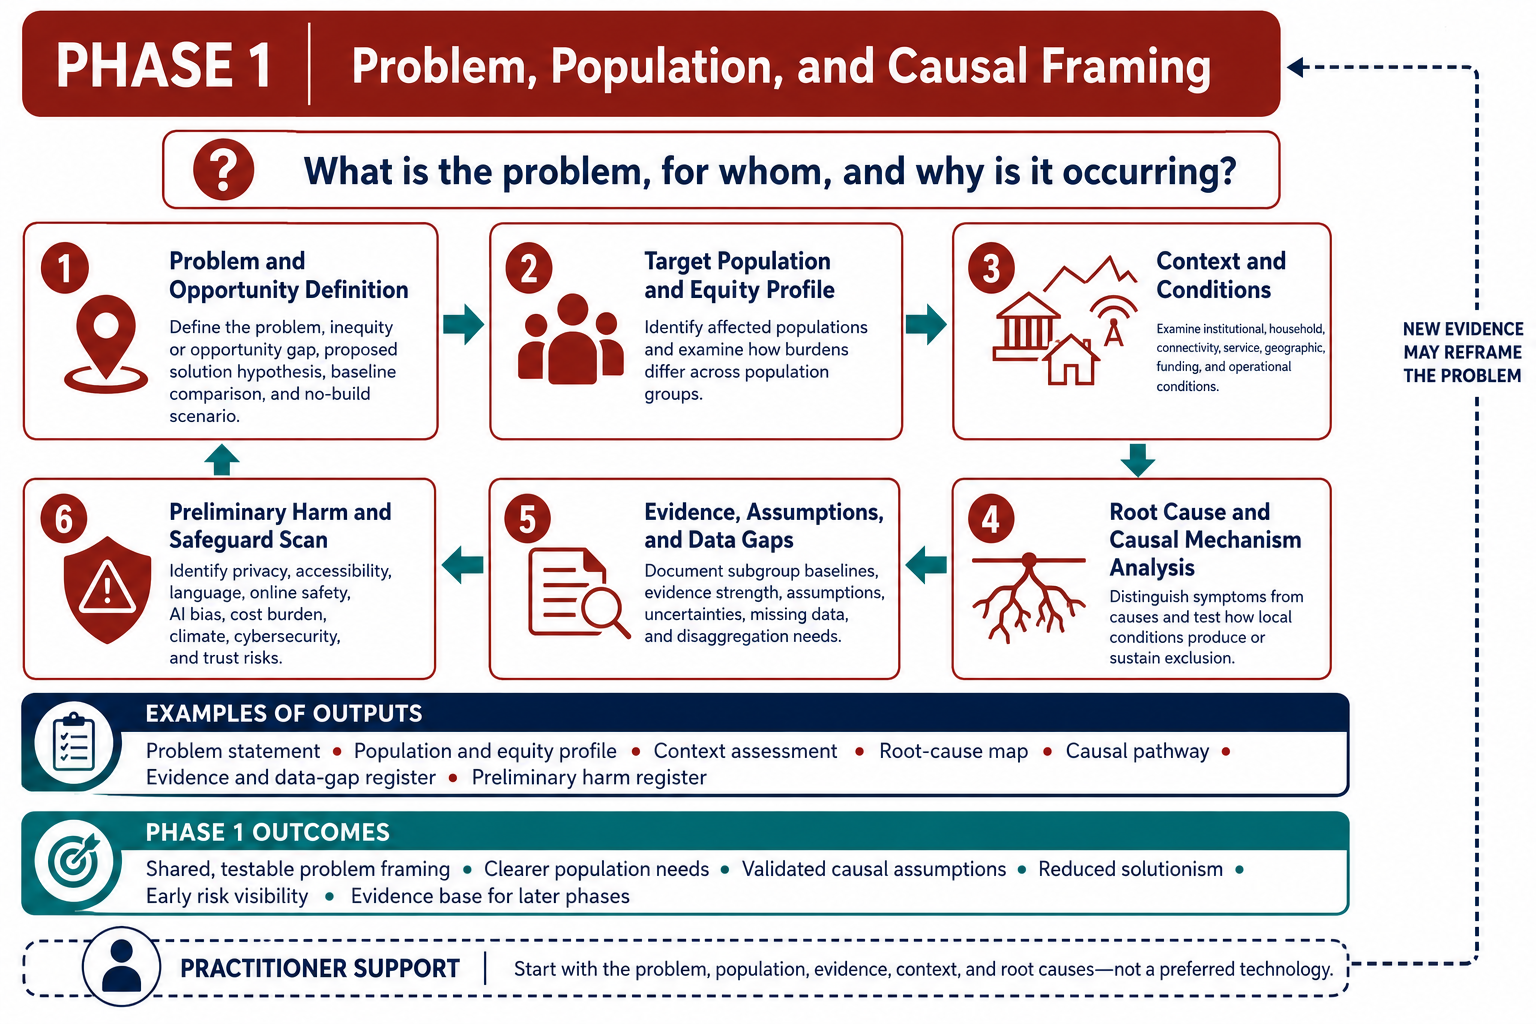
Phase 1 diagram: Problem, population, and causal framing.

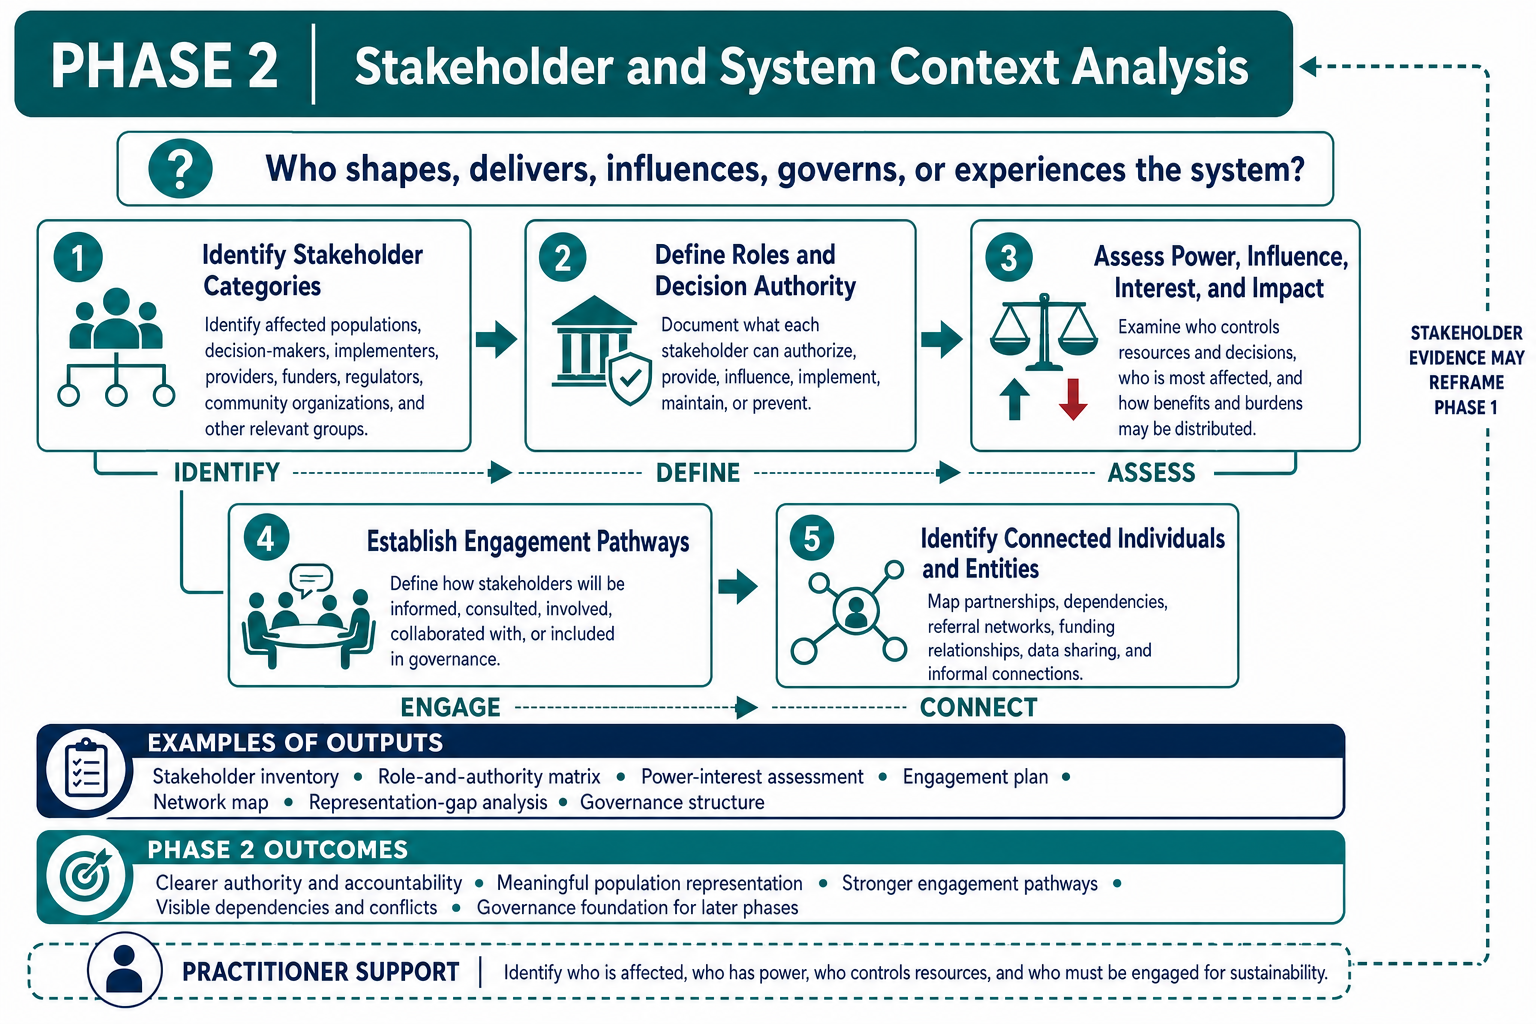
Phase 2 · Map

Stakeholder and system context

Who influences, decides, delivers, and experiences the outcome?

Identify stakeholder categories and individual roles, then assess authority, interest, influence, impact, relationships, and engagement pathways.

Distributed authority

Digital-inclusion work rarely sits within one organization. Schools may understand learning needs but not control broadband infrastructure; providers control service but may not understand household conditions; funders control resources while community organizations hold trust and local knowledge.

Power, responsibility, and voice

The analysis distinguishes formal authority from lived impact. Learners and families may experience the greatest consequences while holding the least decision power. Mapping approval, financing, implementation, maintenance, resistance, knowledge, and influence exposes dependencies and gives affected populations a defined role in validation and governance.

Produces
Stakeholder map, power analysis, role matrix, engagement plan.
Discipline
Give affected populations meaningful influence, not symbolic consultation.
Phase 2 diagram: Stakeholder and system context.

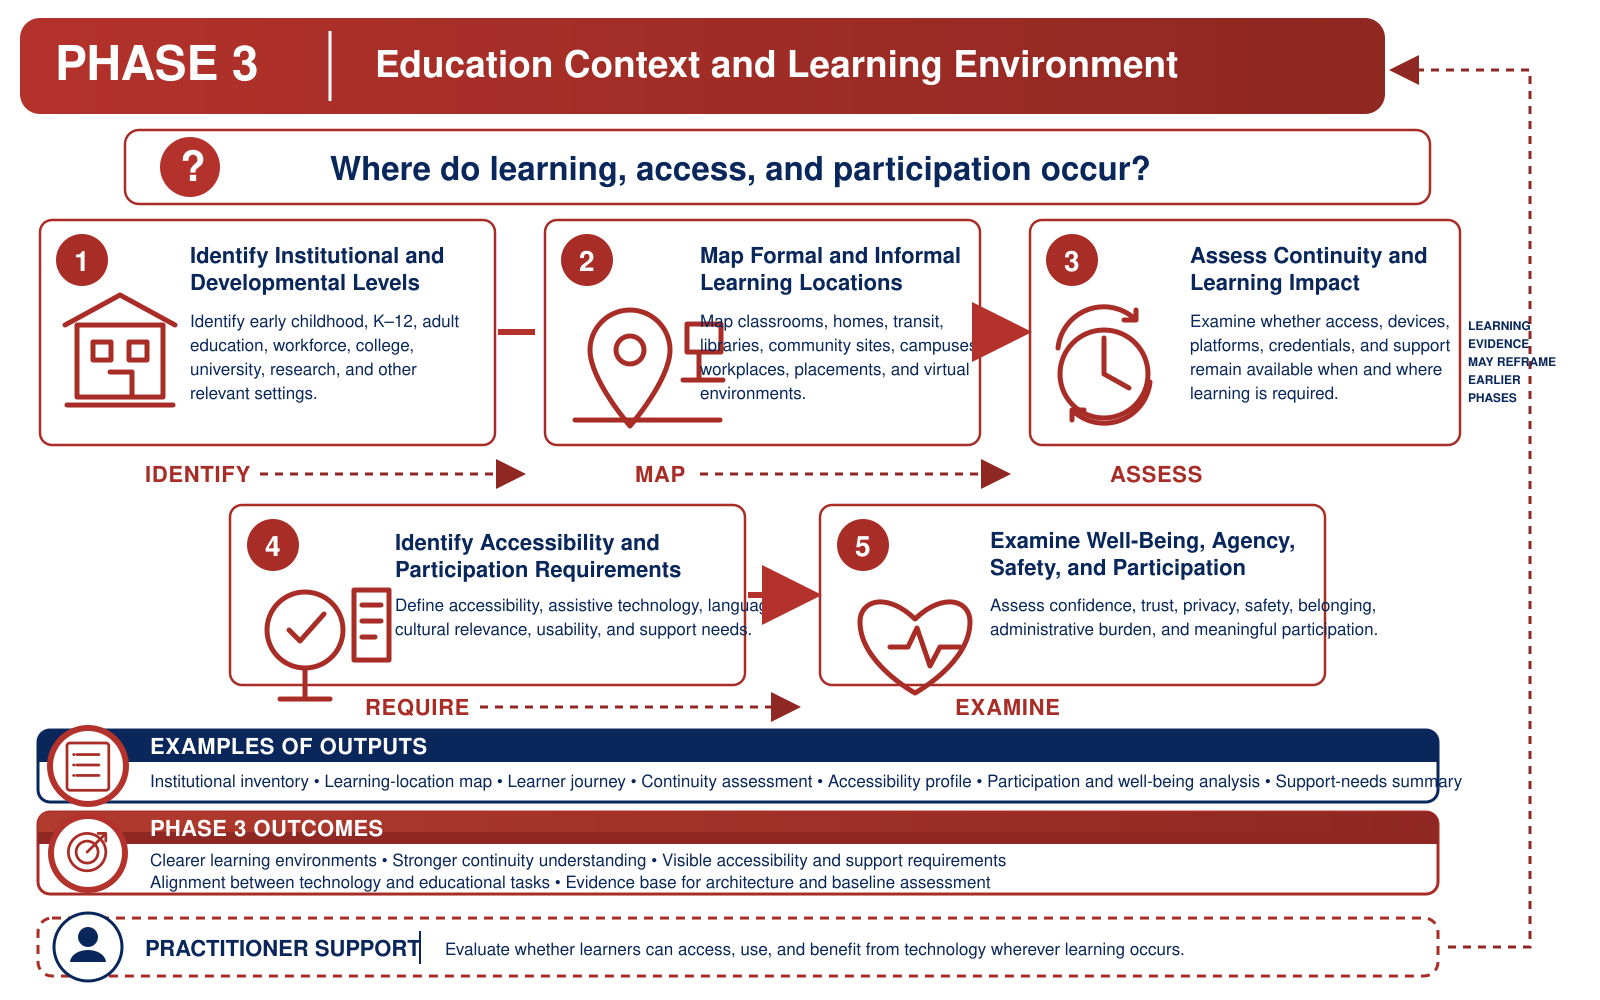
Phase 3 · Learn

Education context and learning environment

Where, how, and under what conditions does participation affect learning?

Map formal and informal learning settings, developmental levels, continuity, accessibility, well-being, safety, institutional readiness, and support.

Learning occurs across environments

Availability at a school or campus does not establish continuity at home, in transit, at work, or in a community setting. The phase examines whether participation changes by location, schedule, instructional activity, device, platform, disability, language, developmental level, or access to assistance.

Institutional choices shape participation

Assignment design, device policies, accessibility, authentication, support hours, educator readiness, family engagement, and community partnerships can either reduce or reproduce inequity. The result is a validated account of what learners must be able to do–and the conditions required for them to do it consistently.

Produces
Learning-context map, accessibility requirements, readiness assessment.
Discipline
Connect technology choices to educational realities.
Phase 3 diagram: Education context and learning environment.

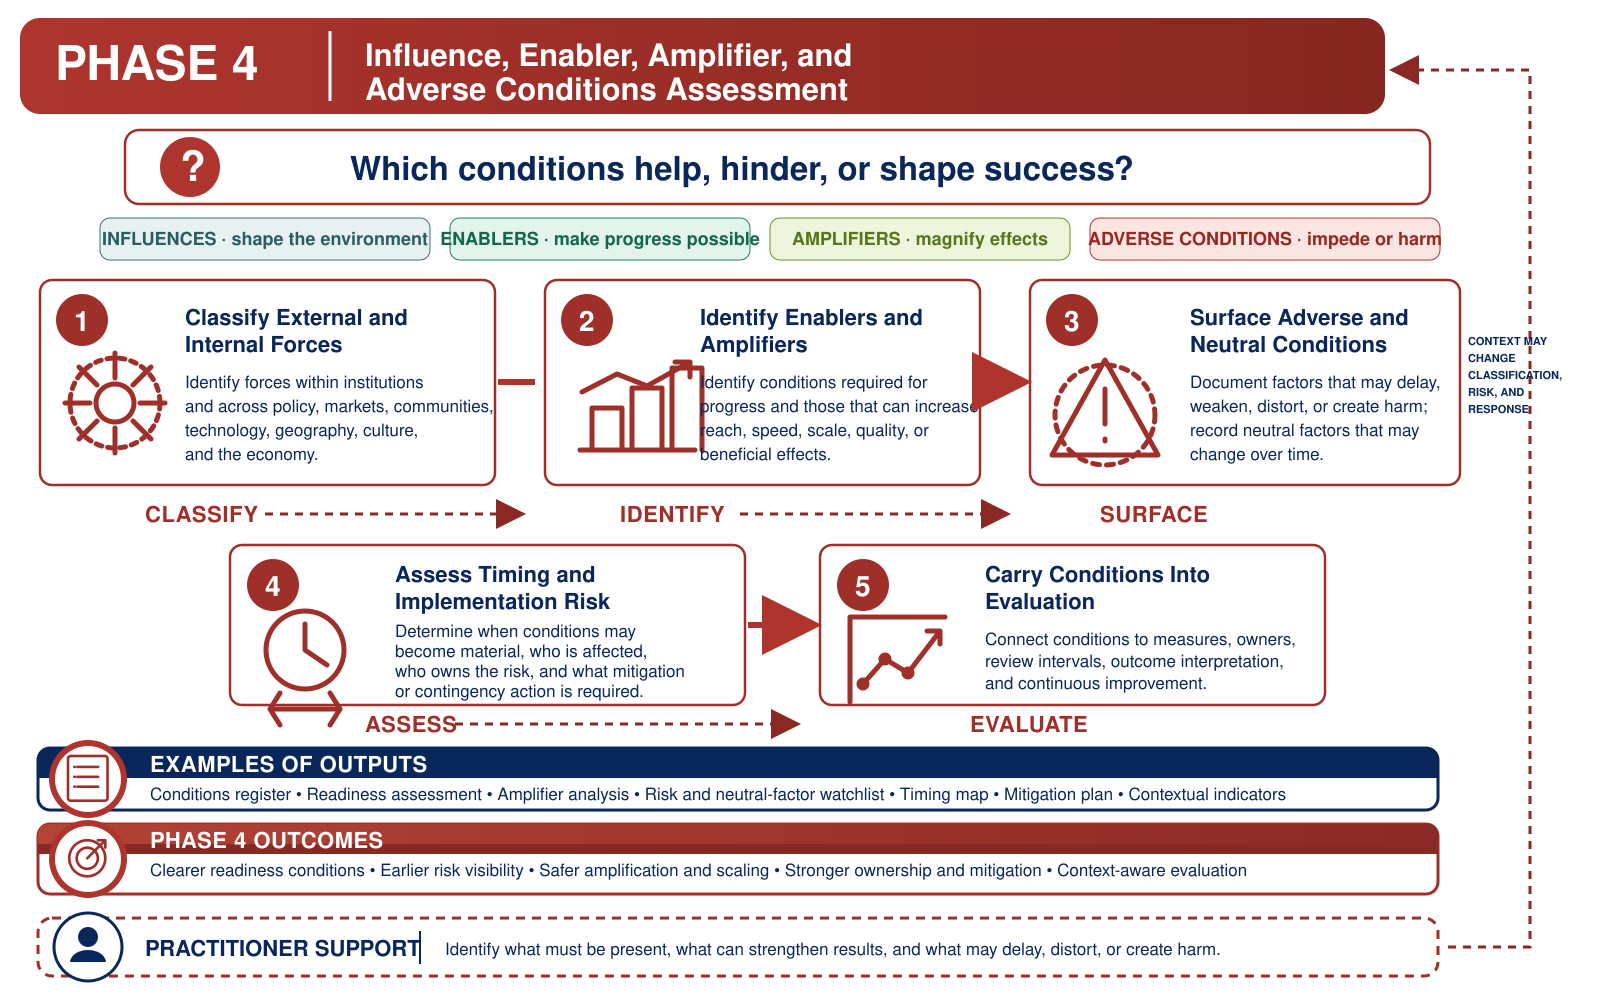
Phase 4 · Scan

Influences, enablers, amplifiers, and adverse conditions

What forces may help, magnify, constrain, or harm?

Classify external and internal forces, timing, implementation risk, neutral conditions, and interactions that must remain visible through evaluation.

Context changes performance

The same intervention can succeed in one setting and fail in another because of political support, institutional capacity, economic conditions, geography, market behavior, cultural relevance, community trust, workforce availability, or timing. Conditions are classified by how they shape the initiative rather than assumed to be background noise.

Hidden dependencies become visible

A solution may depend on temporary grants, one trusted partner, a small number of trained staff, voluntary provider participation, or a policy that can change. Recording these dependencies supports agreements, contingencies, funding plans, workforce development, risk responses, and indicators that monitor whether assumptions remain true.

Produces
Conditions register, risk signals, assumptions, timing analysis.
Discipline
Design for real conditions rather than idealized ones.
Phase 4 diagram: Influences, enablers, amplifiers, and adverse conditions.

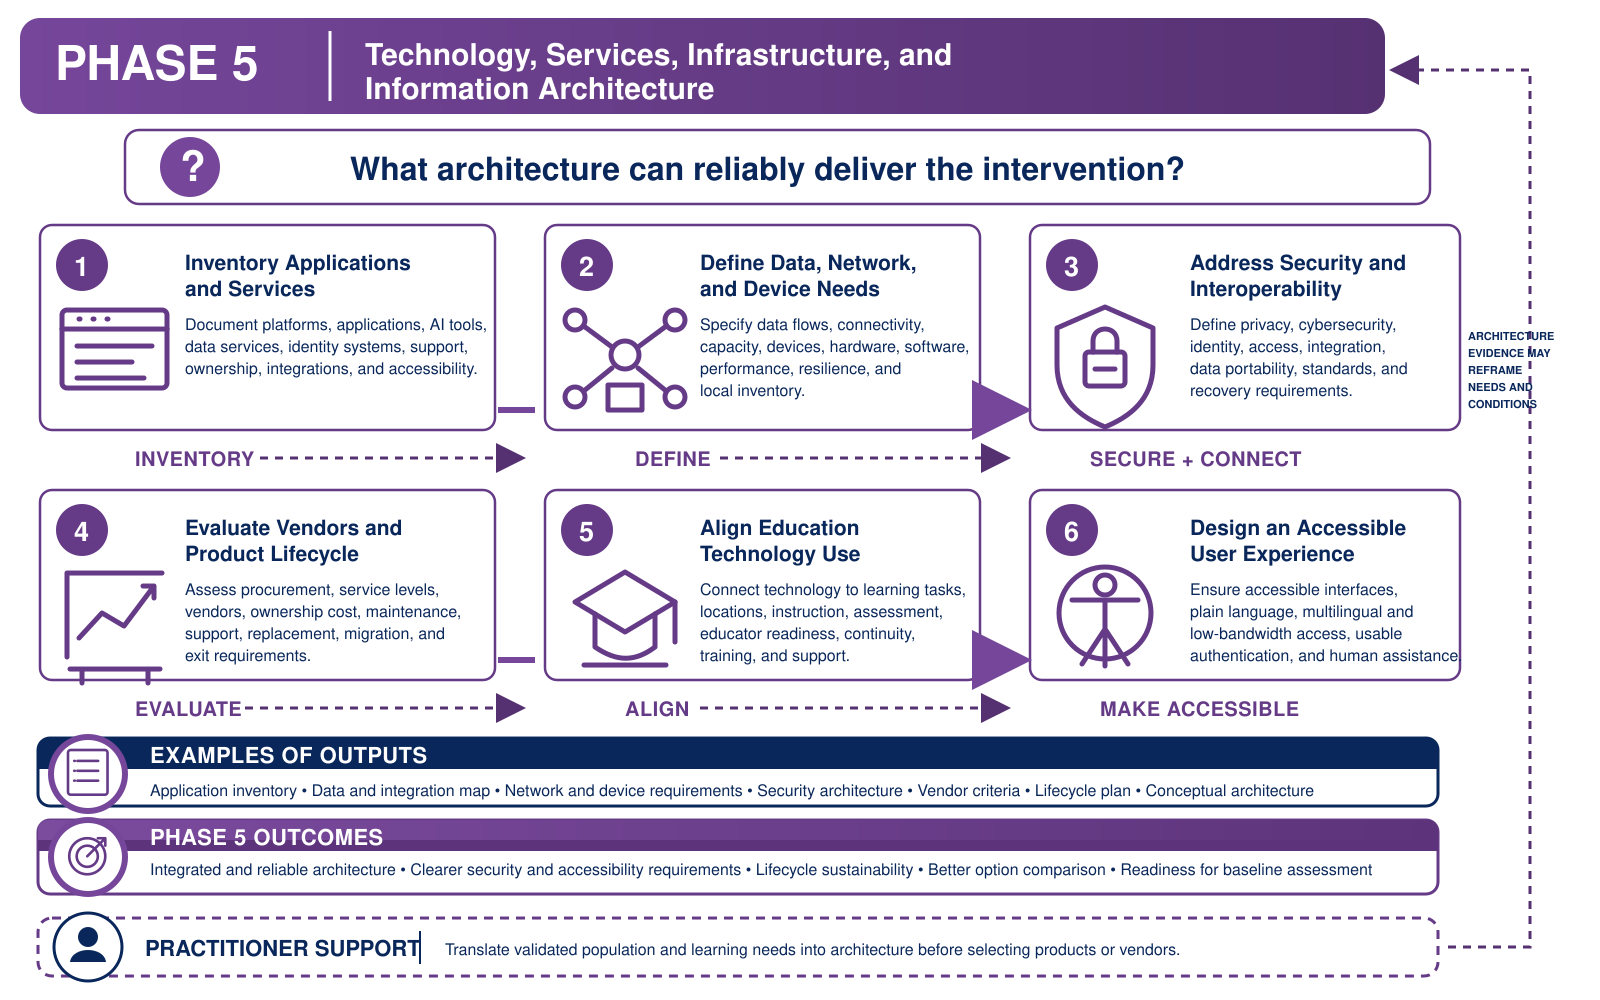
Phase 5 · Architect

Technology, services, infrastructure, and information

What architecture can reliably, safely, and accessibly deliver the intervention?

Align networks, devices, software, data, privacy, identity, interoperability, vendors, procurement, resilience, user experience, and product lifecycles.

Requirements precede products

Population, learning, stakeholder, and contextual evidence is translated into what the system must accomplish before a vendor or product is selected. The architecture covers applications, services, data, connectivity, capacity, devices, security, privacy, identity, interoperability, accessibility, procurement, resilience, support, and replacement cycles.

An operational chain

Digital participation depends on every critical link functioning together. A strong network cannot compensate for inadequate devices, inaccessible software, failed authentication, weak support, unsafe data practices, or equipment that cannot be sustained. Ownership, service levels, redundancy, maintenance, and total cost of ownership are therefore architectural concerns.

Produces
Requirements, preliminary architecture, lifecycle and interoperability plan.
Discipline
Treat technology as a service system, not a purchase.
Phase 5 diagram: Technology, services, infrastructure, and information.

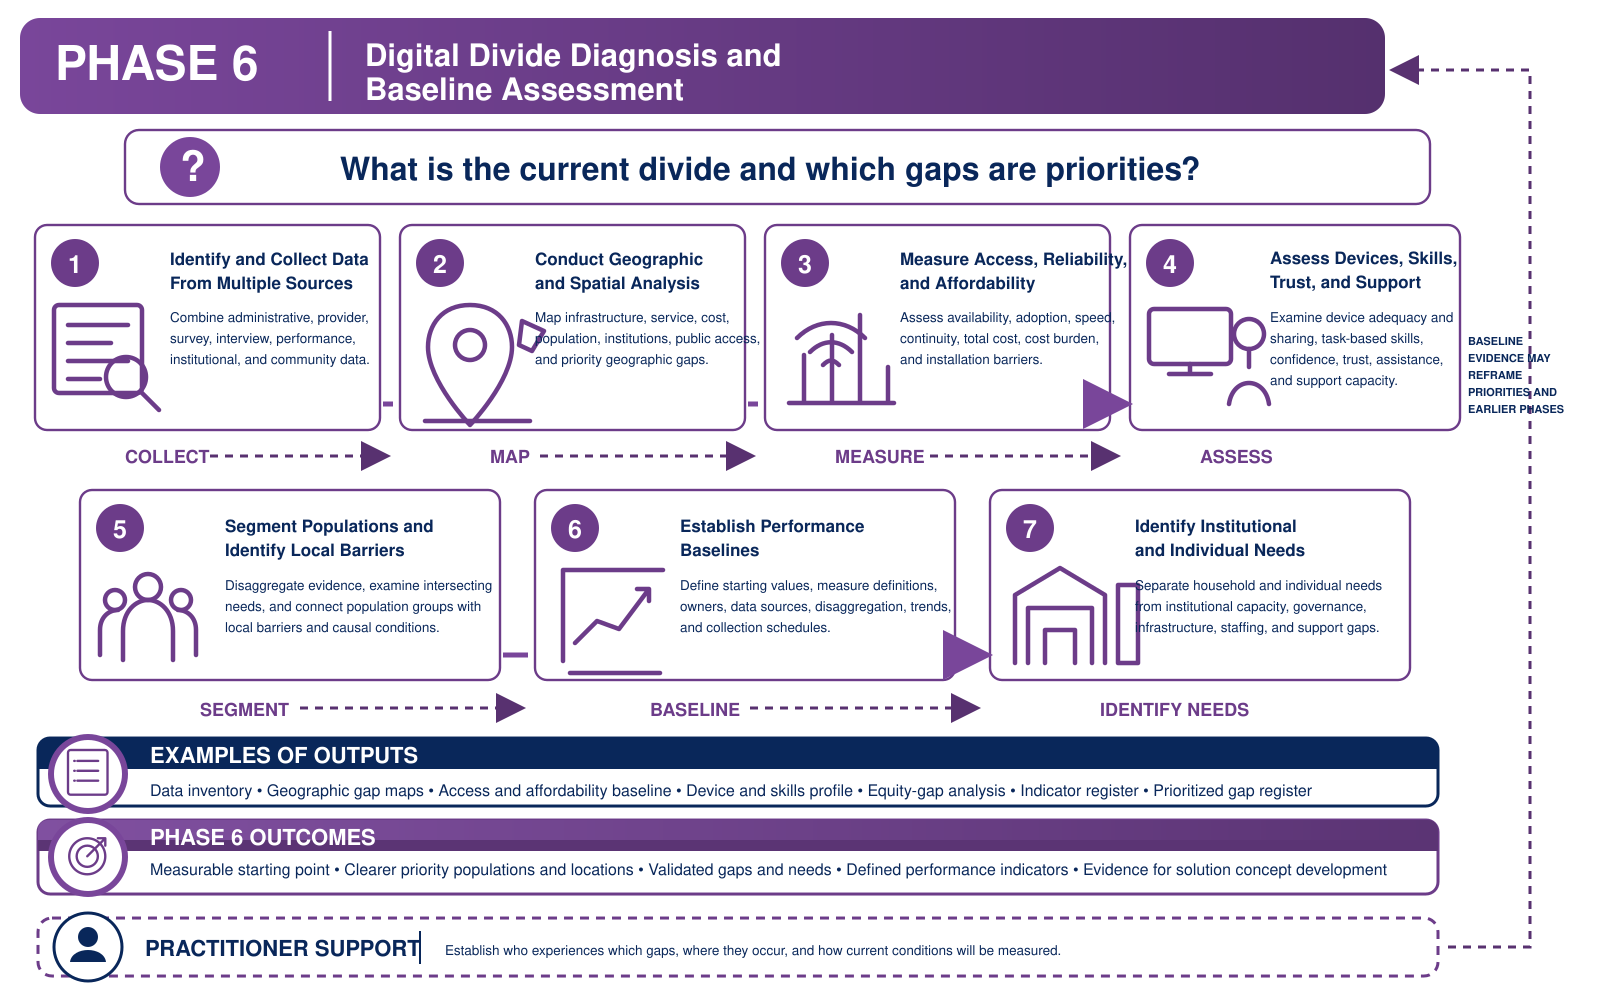
Phase 6 · Diagnose

Digital divide diagnosis and baseline

What is the current state, and which gaps should be prioritized?

Combine geographic, performance, affordability, device, skill, trust, support, population, and institutional evidence into a defensible baseline.

A measurable starting point

An initiative cannot demonstrate change without documenting the conditions that existed before implementation. A general label such as “underserved” is insufficient to select an intervention, prioritize populations, or later determine whether circumstances improved.

Beyond advertised availability

The baseline combines multiple sources to examine actual reliability and performance, price and household burden, device diversity and adequacy, skills, confidence, accessibility, trust, support services, institutional readiness, and local geography. Evidence quality and data gaps are recorded so uncertainty travels honestly into option analysis.

Produces
Baseline, segmented barriers, evidence-quality assessment, prioritized gaps.
Discipline
Measure lived access–not advertised access alone.
Phase 6 diagram: Digital divide diagnosis and baseline.

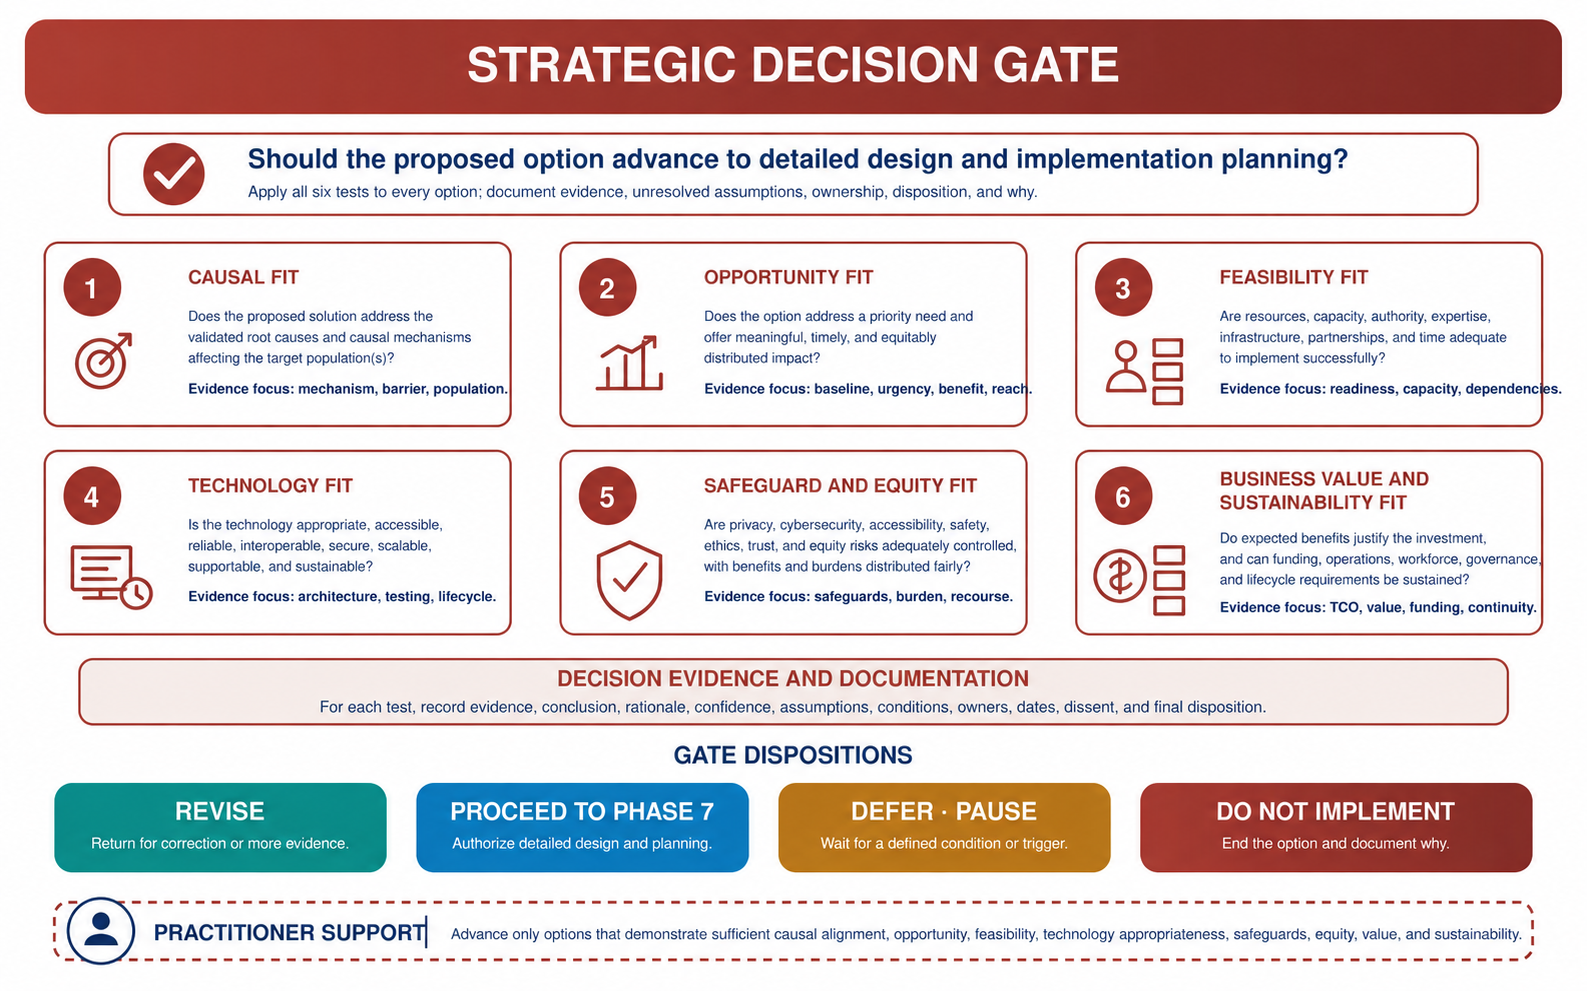
Pre-gate transition & strategic decision

Options must earn the right to proceed.

Return to Phases

Evidence is translated into requirements, alternative concepts, causal pathways, preliminary architecture, costs, benefits, funding assumptions, risks, and safeguards. Each option is then tested.

Causal fit

Does the option address the diagnosed cause?

Opportunity fit

Does it create the intended benefit for the priority population?

Feasibility fit

Can the institution, community, funding, and workforce support it?

Technology fit

Will the architecture perform, integrate, scale, and survive its lifecycle?

Safeguard & equity fit

Are accessibility, privacy, safety, inclusion, and unintended harms addressed?

Value & sustainability fit

Can benefits endure beyond initial deployment or grant funding?

Gate dispositions: revise · proceed to Phase 7 · defer or pause · do not implement.

Strategic Decision Gate showing six non-overlapping evaluation tests and four gate dispositions
The Strategic Decision Gate tests each option across causal, opportunity, feasibility, technology, safeguard and equity, and sustainability fit.

Chapter II · Act and learn

Turn an approved option into accountable change.

The final four phases translate strategic approval into a delivery system with explicit governance, performance evidence, operational learning, and evaluation. They distinguish visible activity from meaningful and equitable change.

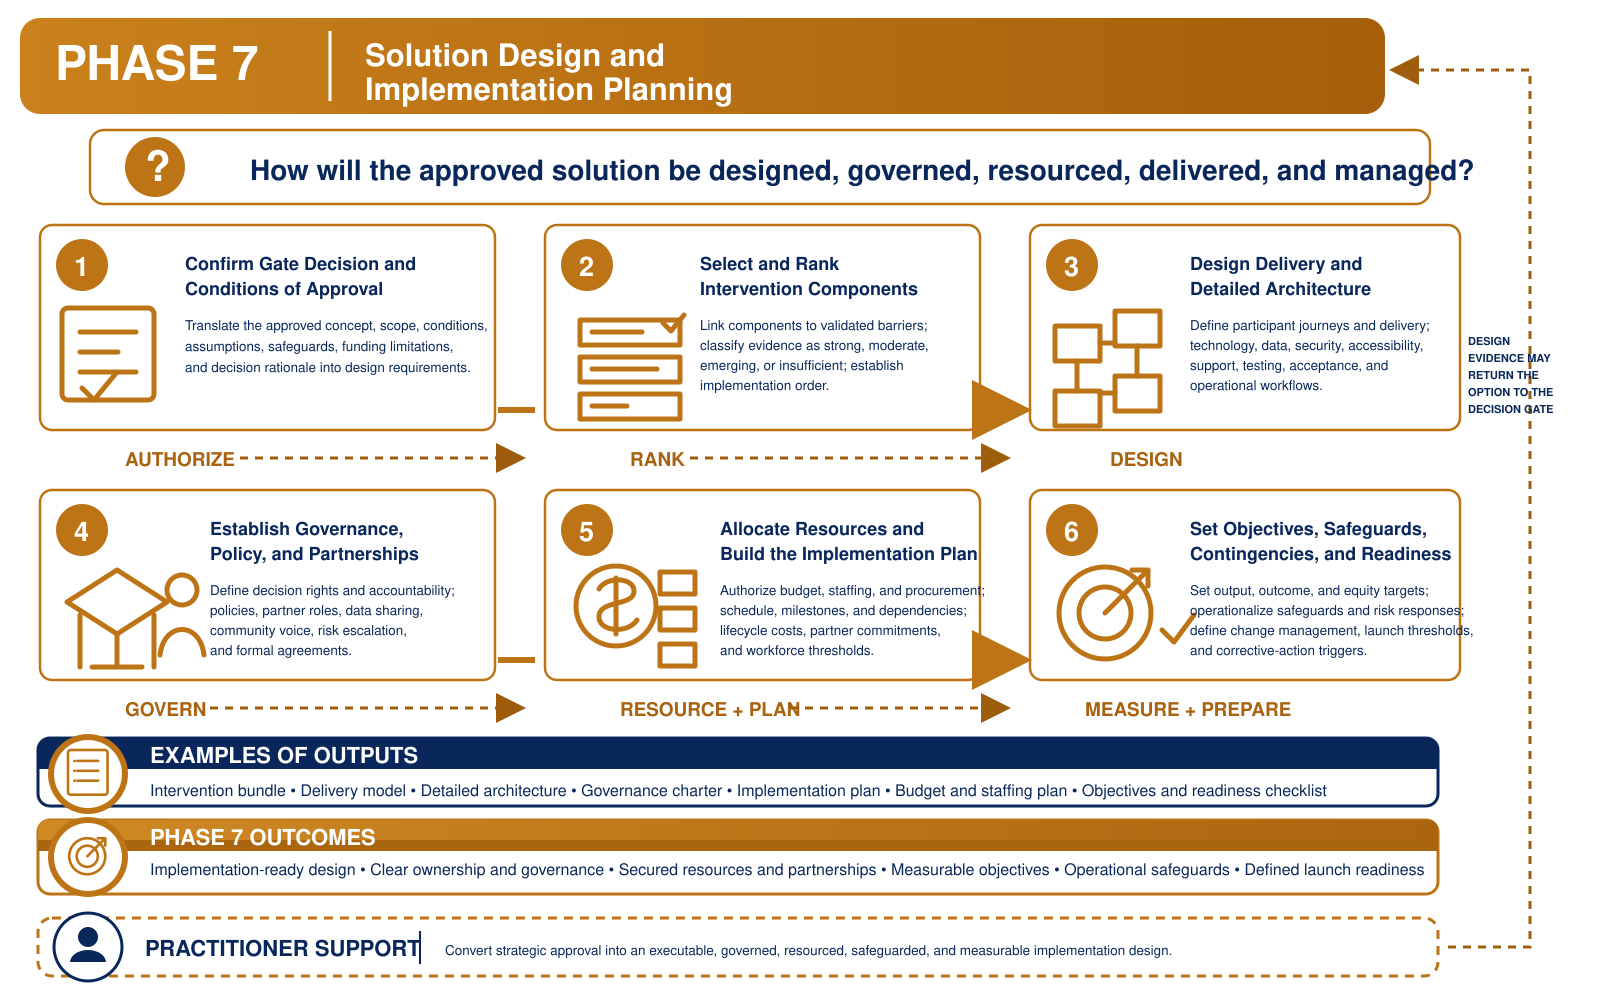
Phase 7 · Design

Solution design and implementation planning

How will the approved option be delivered, governed, and supported?

Finalize interventions, delivery model, technology, governance, partnerships, implementation, costs, staffing, procurement, safeguards, contingencies, communications, and readiness thresholds.

Approval is not readiness

The Strategic Decision Gate establishes why an option should advance and under what conditions. Phase 7 establishes exactly how it will work. The intervention bundle, delivery model, governance, partnerships, detailed design, staffing, funding, procurement, measurable objectives, communications, safeguards, and contingencies become implementation commitments.

Organizational capacity is part of the design

A sound concept can still fail when staff, policies, support capacity, partner agreements, data systems, or decision rights are missing. Readiness thresholds make these dependencies explicit and prevent procurement or deployment from moving ahead before the institution is capable of delivering the intended service.

Produces
Implementation plan, delivery model, governance and resource commitments.
Discipline
Build accountability before launch.
Phase 7 diagram: Solution design and implementation planning.

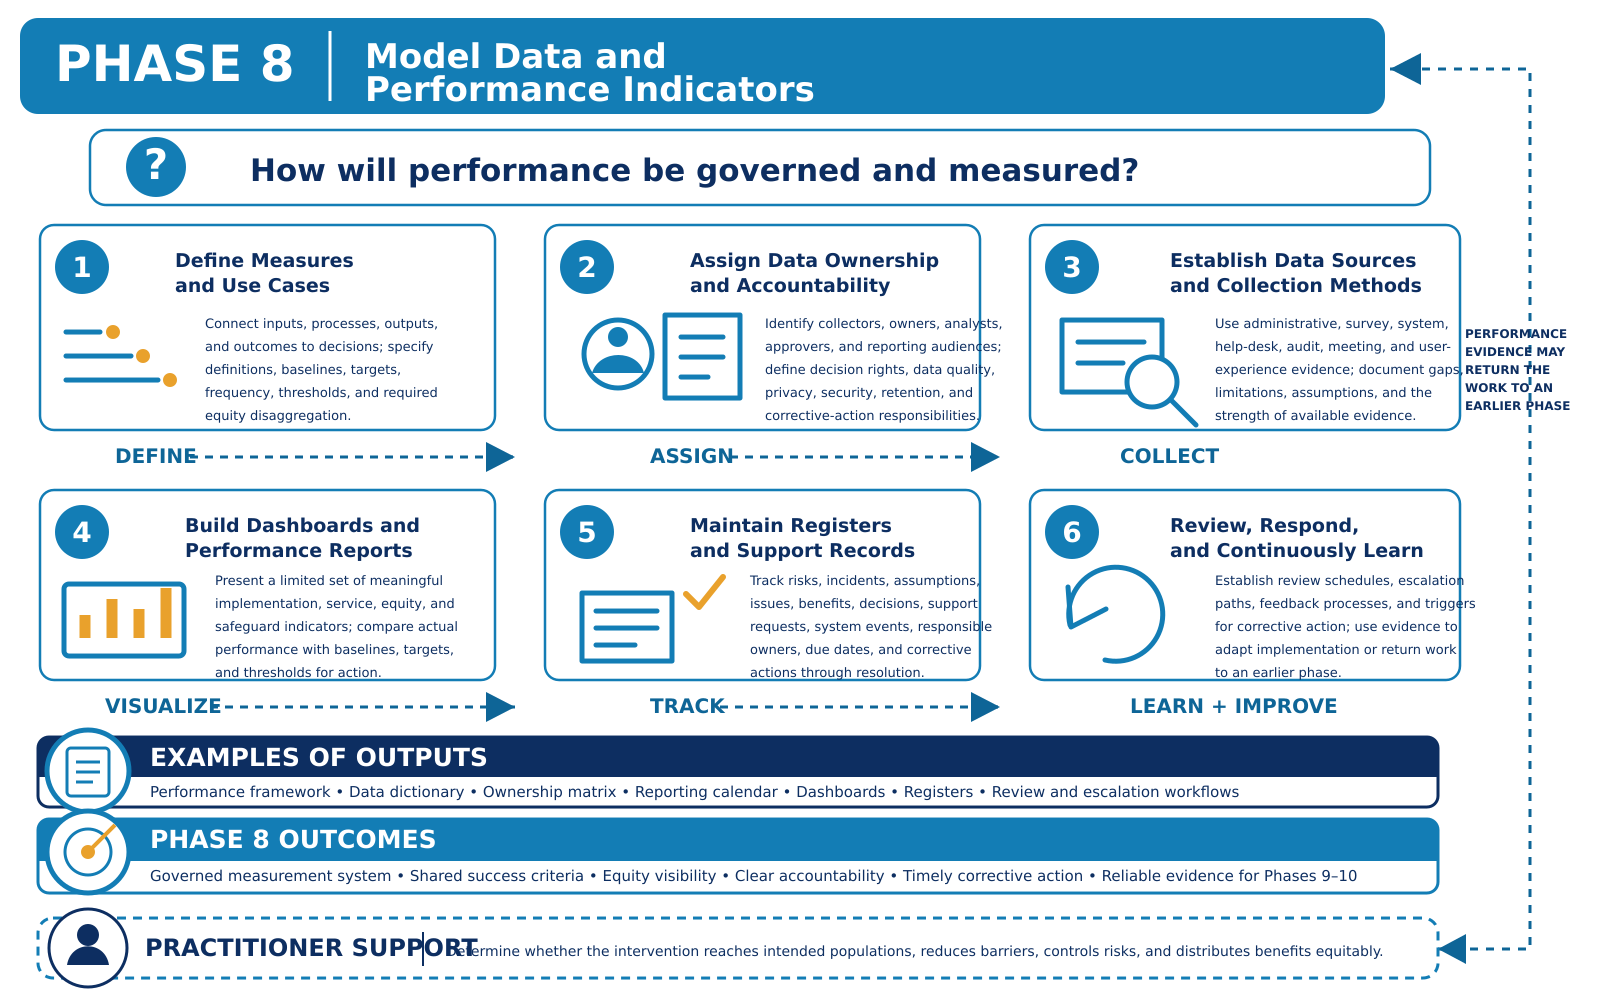
Phase 8 · Measure

Model data and performance indicators

How will performance, equity, benefit, and harm be observed?

Define balanced measures, use cases, ownership, accountability, data quality, baselines, targets, collection, reporting, and interpretation.

Activity does not demonstrate inclusion

Devices distributed, households connected, or training sessions completed document activity but do not establish that services are reliable, affordable, usable, supported, accessible, safe, or producing participation. Measures must connect objectives, outputs, outcomes, safeguards, baselines, targets, and data sources.

Governed evidence

Practitioners define why each measure matters, who owns it, how it is collected and protected, how frequently it is reviewed, and what decision it supports. Disaggregated quantitative indicators are paired with qualitative experience so populations receiving lower-quality service or disproportionate burdens remain visible.

Produces
KPI framework, data ownership, targets, reporting routines.
Discipline
Measure what matters to users and decision-makers.
Phase 8 diagram: Model data and performance indicators.

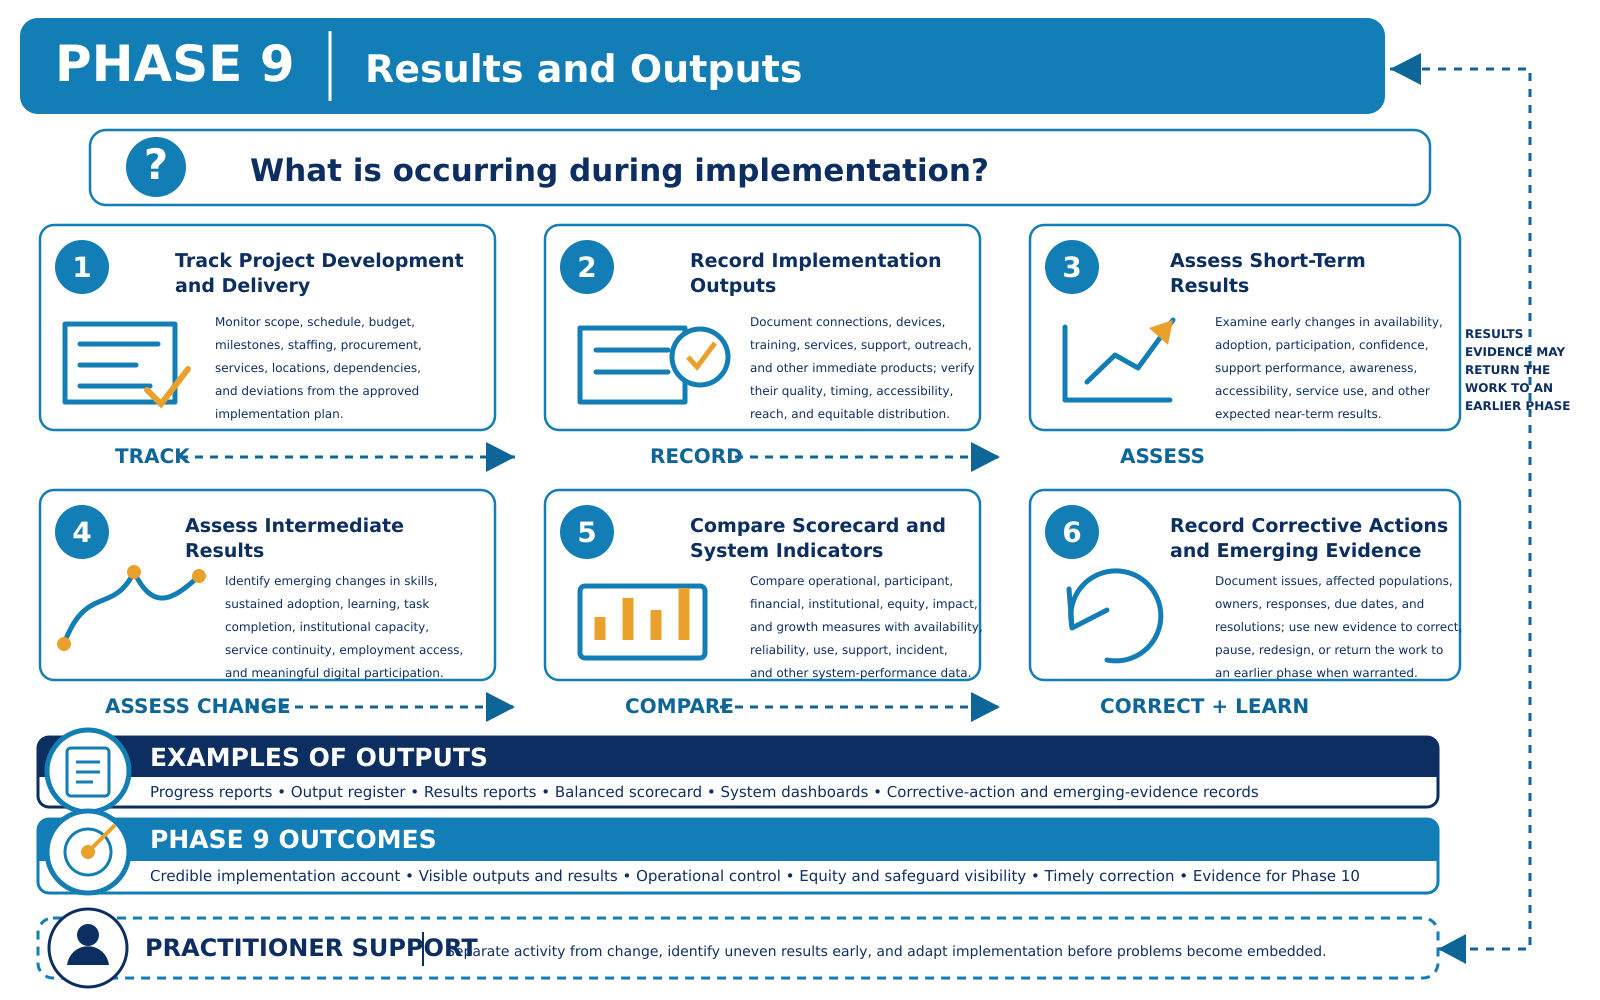
Phase 9 · Deliver

Results and outputs

What is occurring during implementation?

Track delivery progress, document outputs, assess short-term and intermediate results, compare system indicators, surface unintended effects, and record corrective actions.

Evidence during delivery

The performance system becomes operational as actual implementation is compared with the approved plan, baseline, targets, expected benefits, resource commitments, and safeguards. Practitioners document what was delivered, who was reached, what resources were used, and where performance differs from expectations.

Correct while change is still possible

Milestones, scorecards, issue and risk registers, service data, stakeholder feedback, and emerging outcome evidence support operational control. Unequal participation, quality differences, unintended results, and unresolved barriers are surfaced early enough to trigger corrective action rather than being discovered only in a final evaluation.

Produces
Progress evidence, output record, early results, corrective actions.
Discipline
Do not confuse activity or construction with impact.
Phase 9 diagram: Results and outputs.

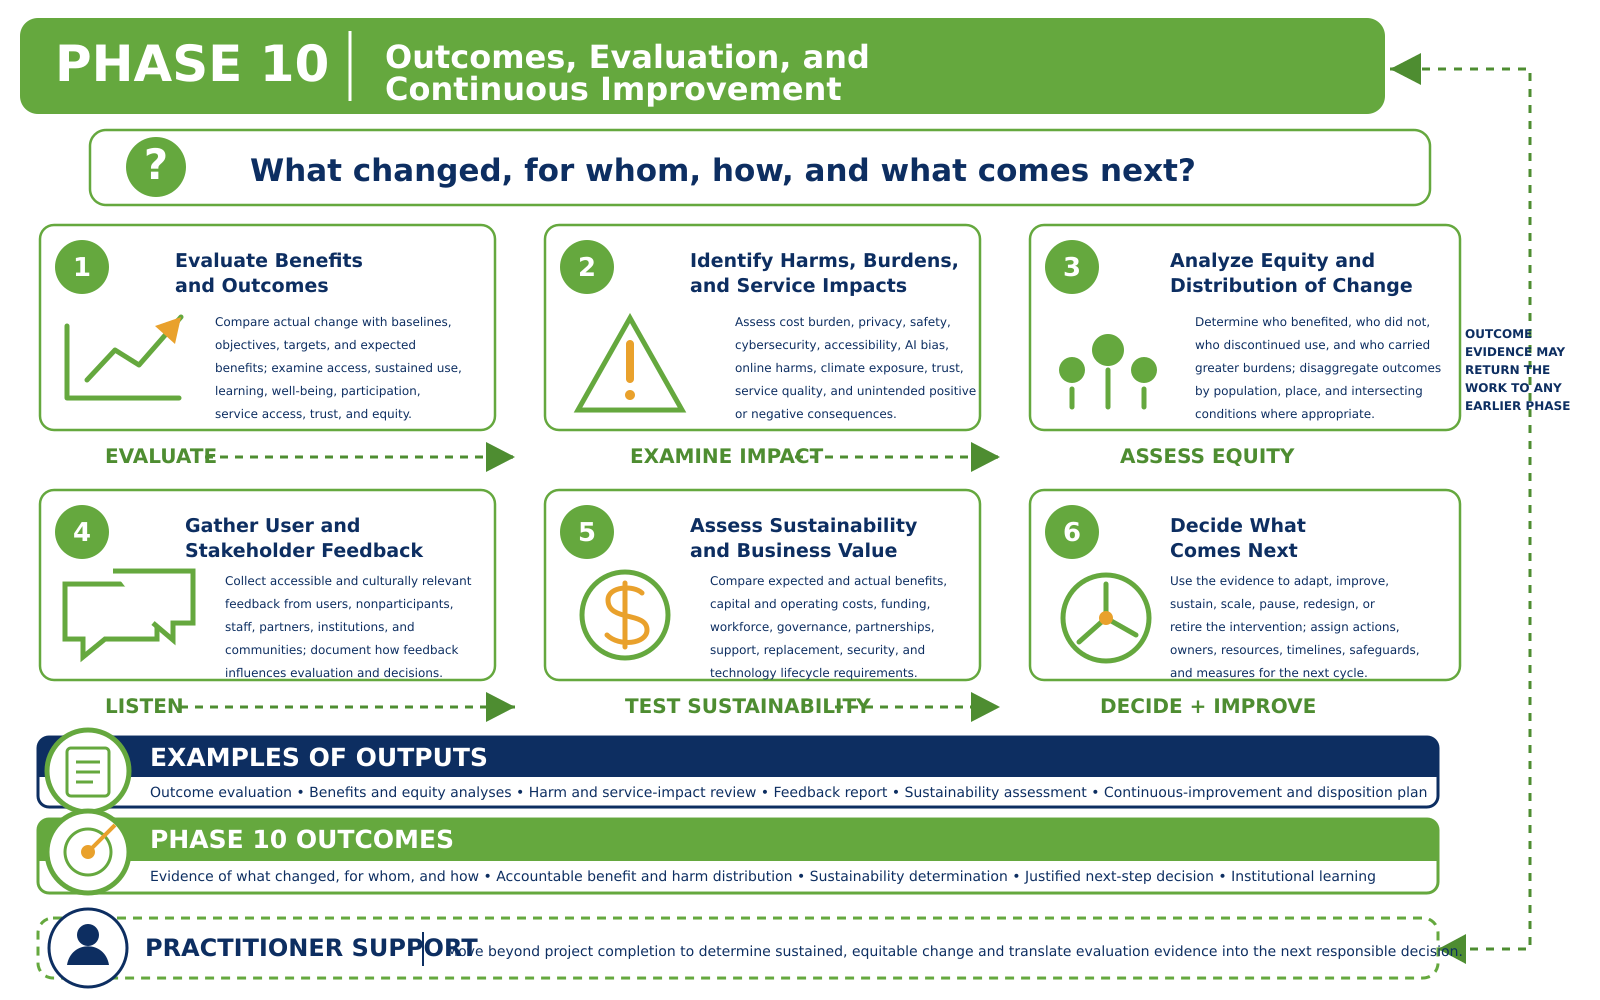
Phase 10 · Improve

Outcomes, evaluation, and continuous improvement

What changed, for whom, how, and what comes next?

Evaluate benefits, outcomes, harms, satisfaction, adoption, sustained use, sustainability, business value, and feedback. Return the learning to earlier phases.

Determine meaningful change

Evidence from every earlier phase is brought together to determine whether validated barriers were reduced, intended benefits occurred, foreseeable harms were controlled, and benefits and burdens were distributed equitably. Evaluation distinguishes what changed from why it changed and for whom.

Close the loop

Adoption, satisfaction, sustained use, institutional effects, total cost, operating capacity, and business value shape the decision to sustain, scale, revise, pause, or end the intervention. Stakeholder experience and outcome evidence return to problem framing, stakeholder analysis, architecture, diagnosis, and design so the model remains responsive as technology and conditions change.

Produces
Outcome evaluation, lessons, adaptations, next-cycle decisions.
Discipline
Keep the model alive after launch.
Phase 10 diagram: Outcomes, evaluation, and continuous improvement.

Visual walkthrough

Walk through the phases and decision gate.

Move through the complete model in sequence. Use the embedded controls to enlarge each graphic without leaving the walkthrough.

See how the same model produces different field solutions.

Applied cases →