Section 03 · Dissertation Mechanics

MindMapping Memos

Hand-drawn visual memos documenting how questions, evidence, theories, stakeholders, and possible solutions were brought into relationship during the research.

Detailed hand-drawn visual memo centered on Closing the Digital Divide and the problem space

A visual research record

Thinking made visible.

These maps are analytical memos rather than polished diagrams. They preserve the movement of inquiry: ideas are clustered, connected, questioned, revised, and placed beside evidence from policy, education, technology, community practice, and theory. Read together, they show the study widening from an immediate crisis response into a multidimensional account of the digital divide.

Each image can be opened and enlarged. The accompanying narrative offers an interpretive guide; it does not replace the detail or nonlinear relationships held in the original map.

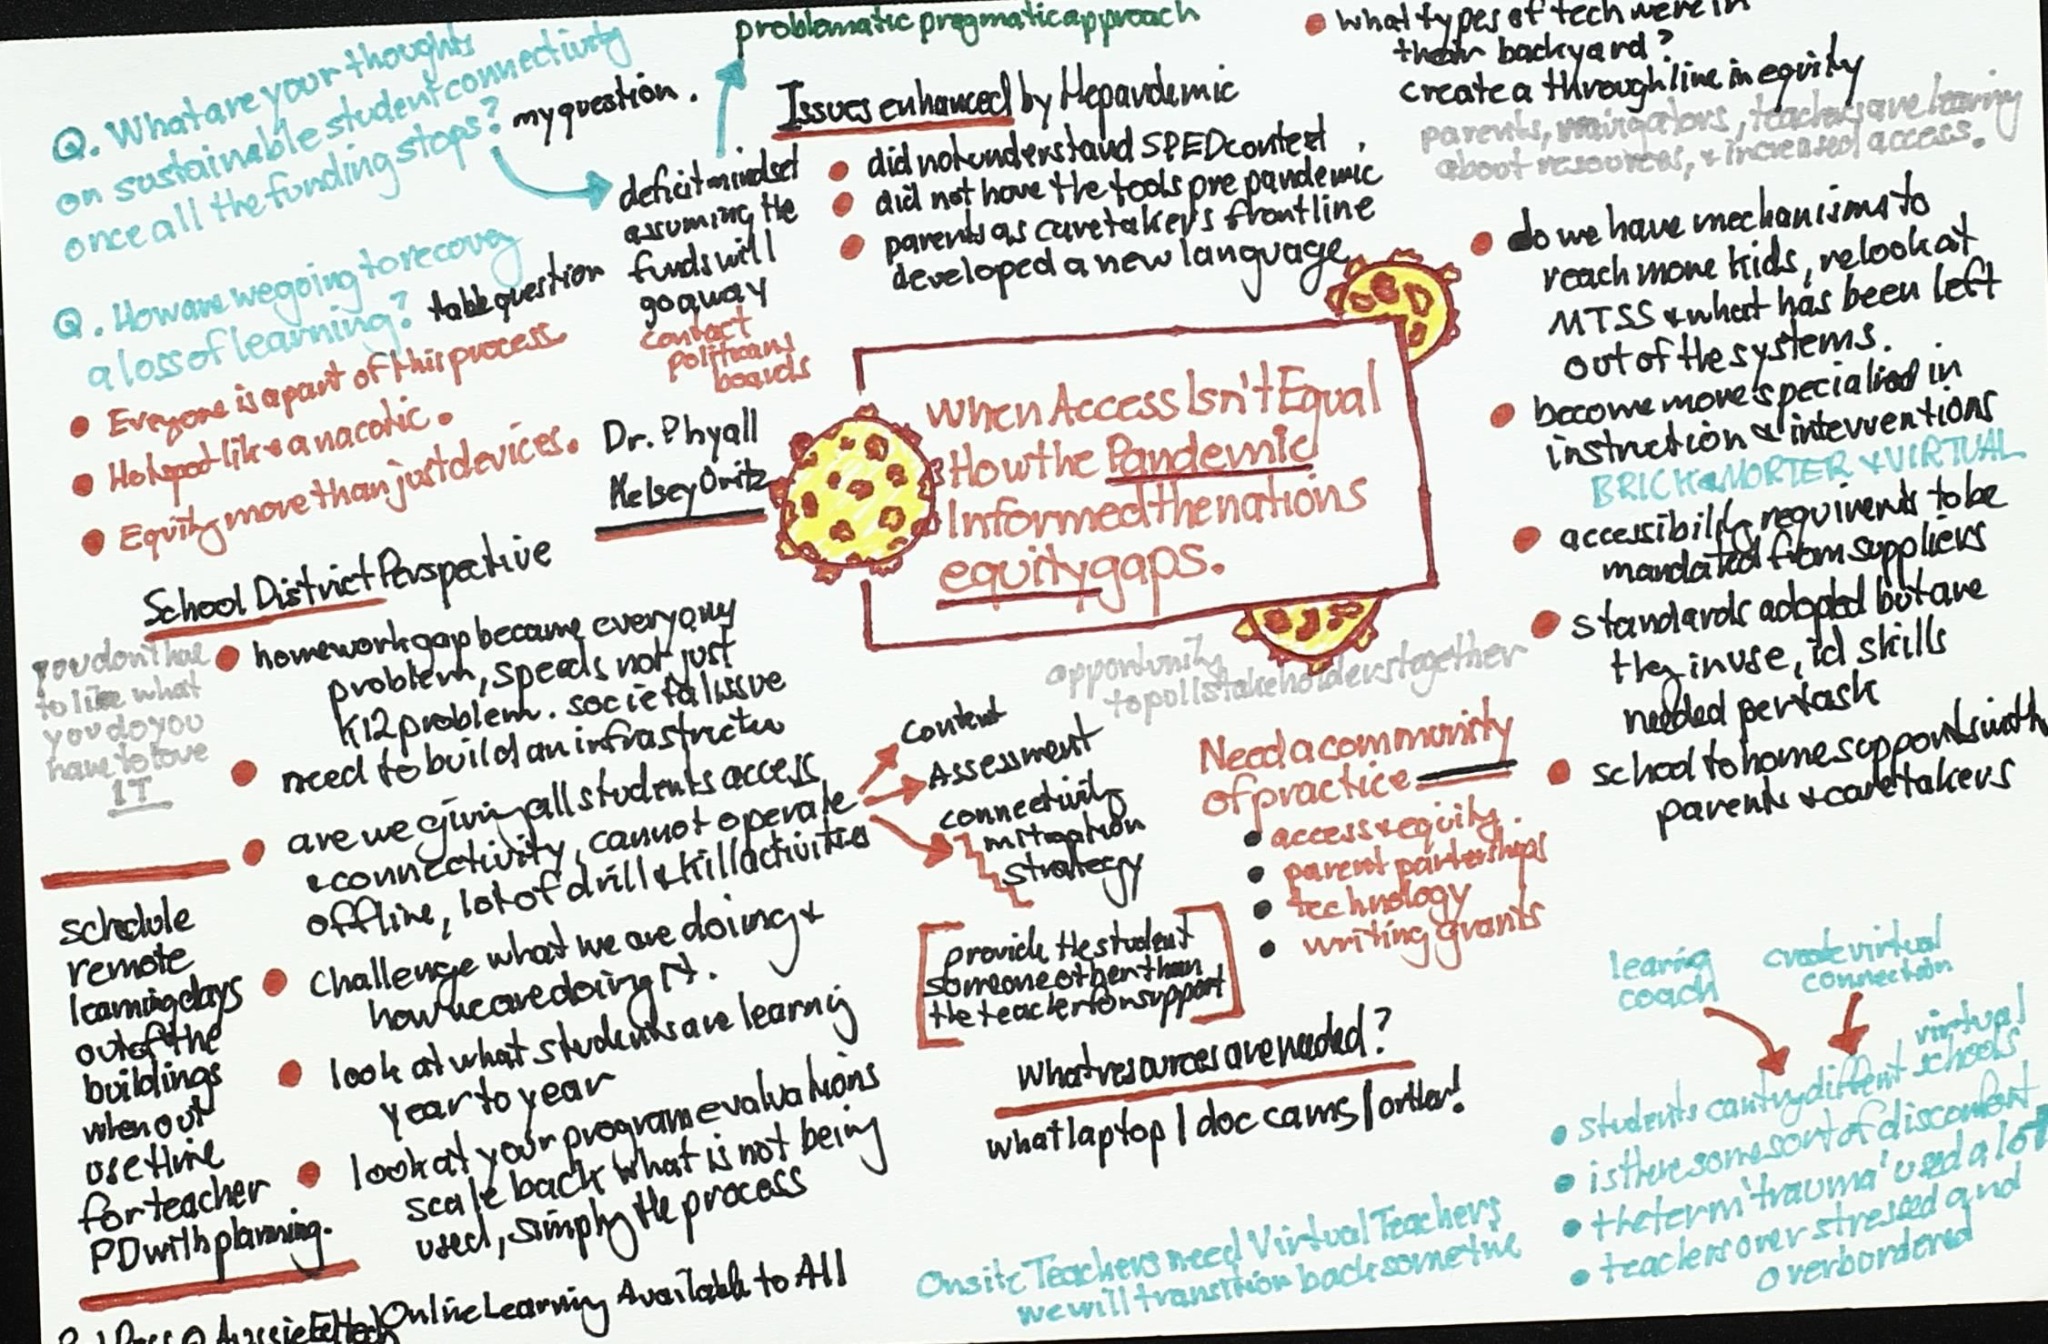
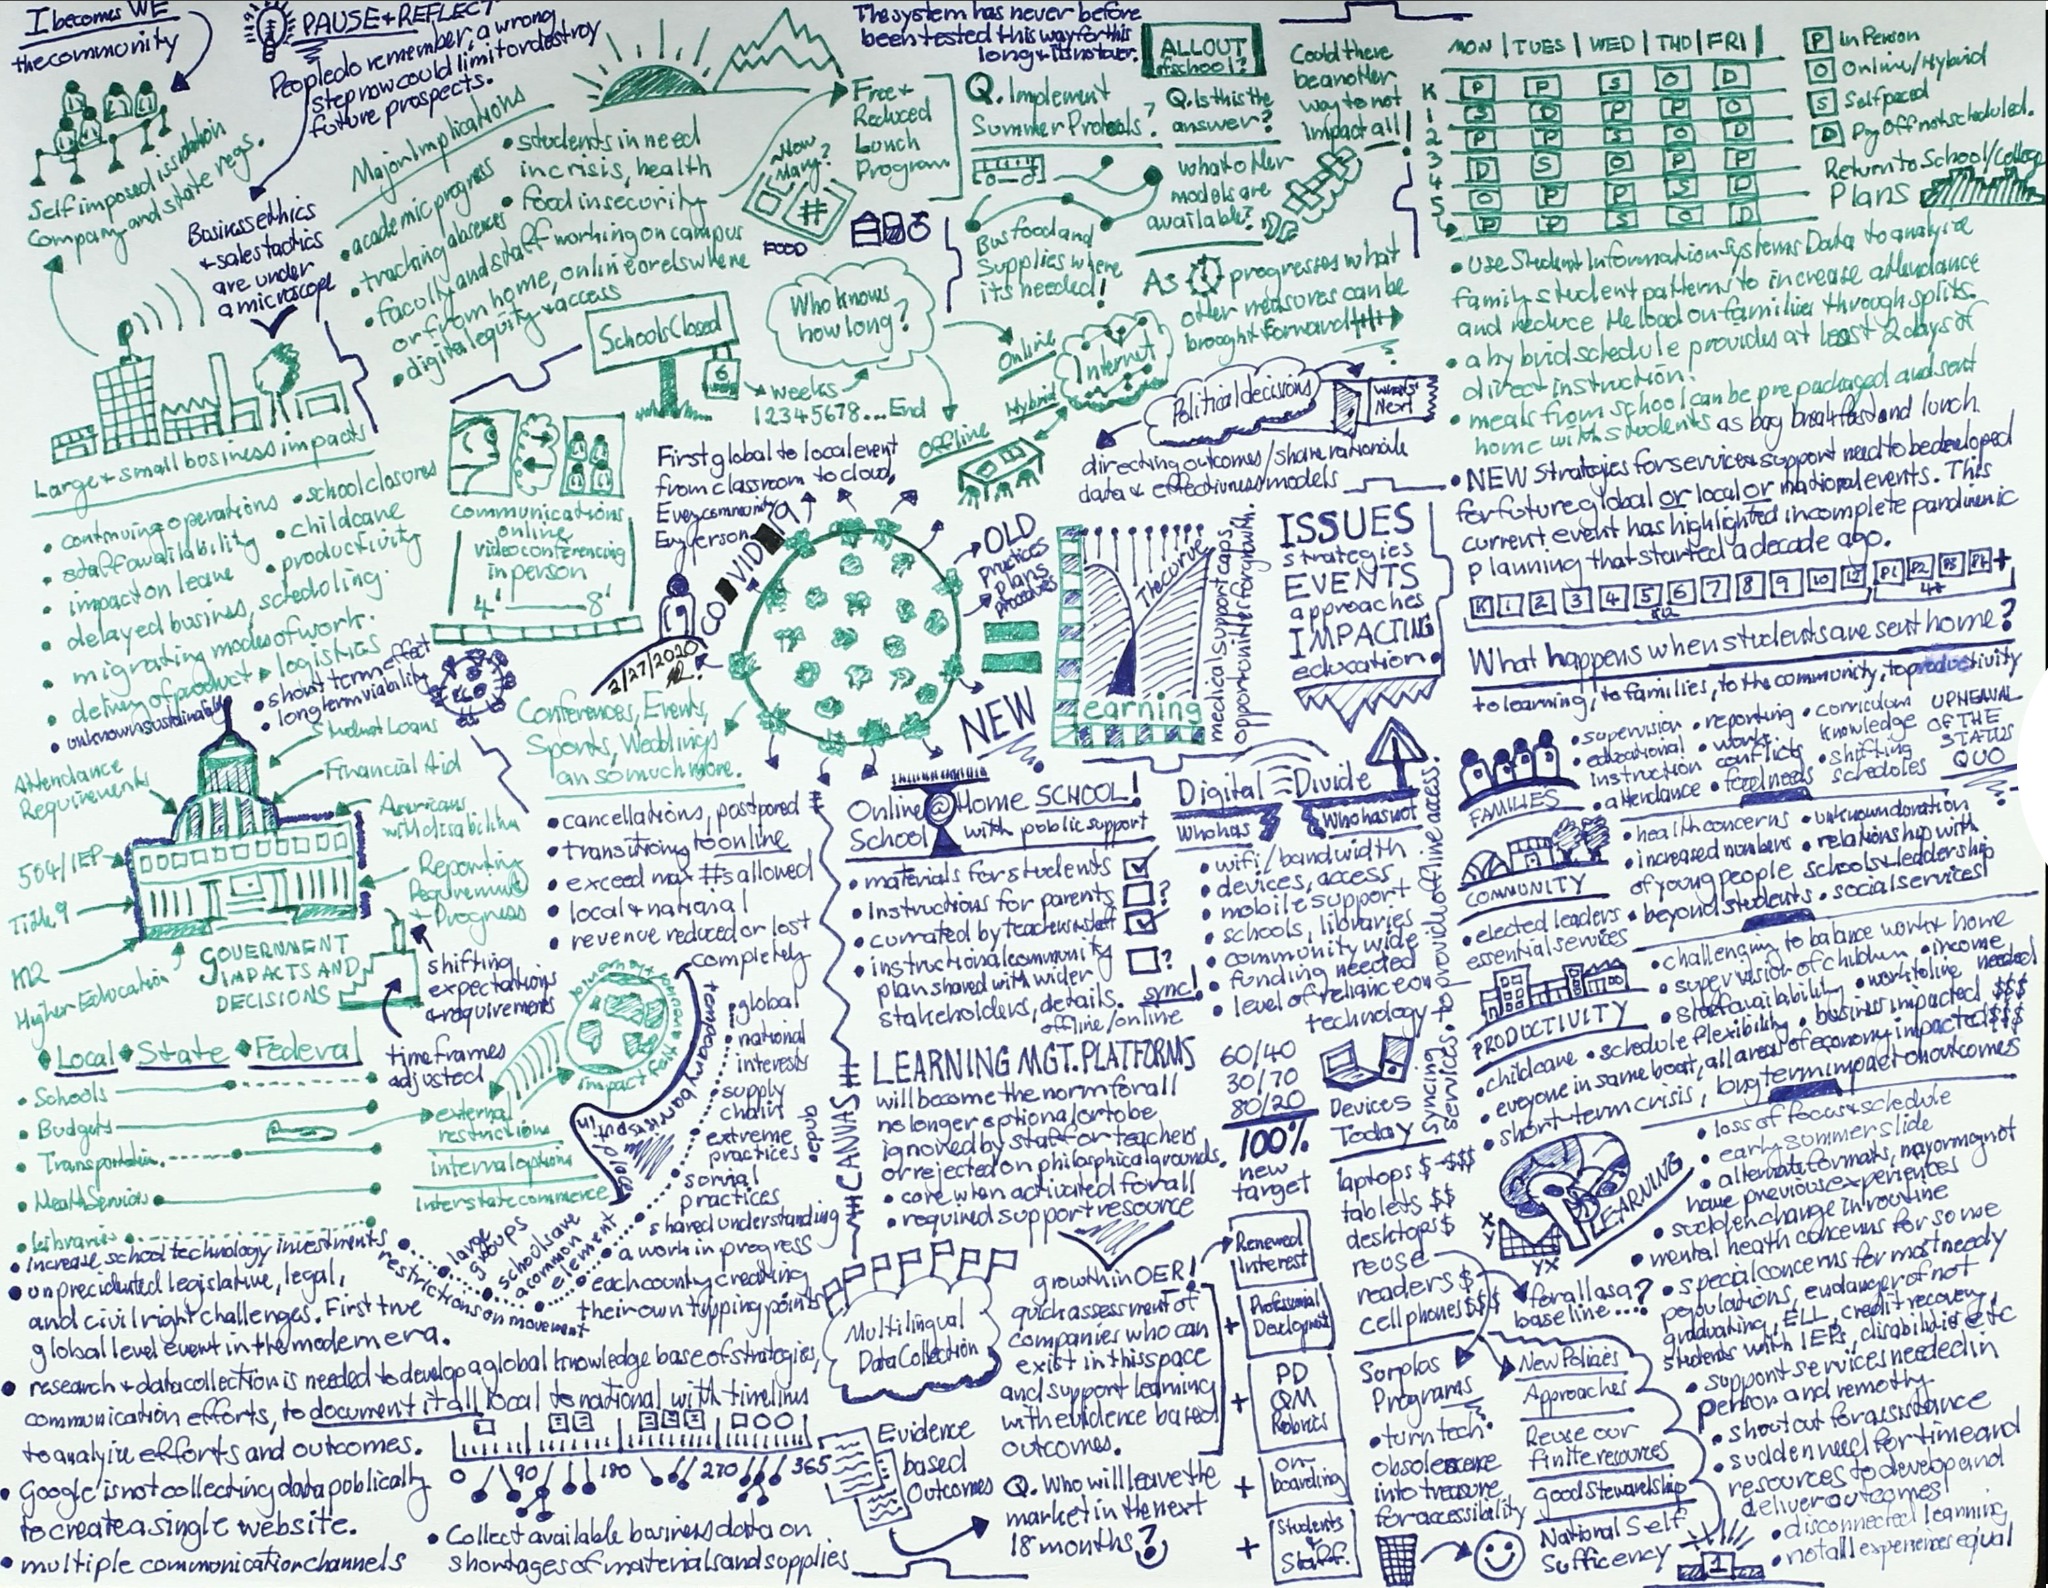
Visual memo created in 2020 about pandemic disruption, education, government, community, and digital access
DD Vision 2020. A broad environmental scan of disruption and response during the early pandemic period.

Origins and disruption

DD Vision 2020

This early map captures a moment when schooling, work, public services, and community life moved abruptly online. It links institutional decisions with consequences for families, students, educators, businesses, and government. Devices, bandwidth, support, food access, schedules, health, and the durability of emergency programs appear as parts of one connected system.

How to read it: begin at the central COVID-19 form, then follow the branches outward. The map makes a central research premise visible: access is not a single device or connection, but a shifting relationship among infrastructure, institutions, support, and lived conditions.
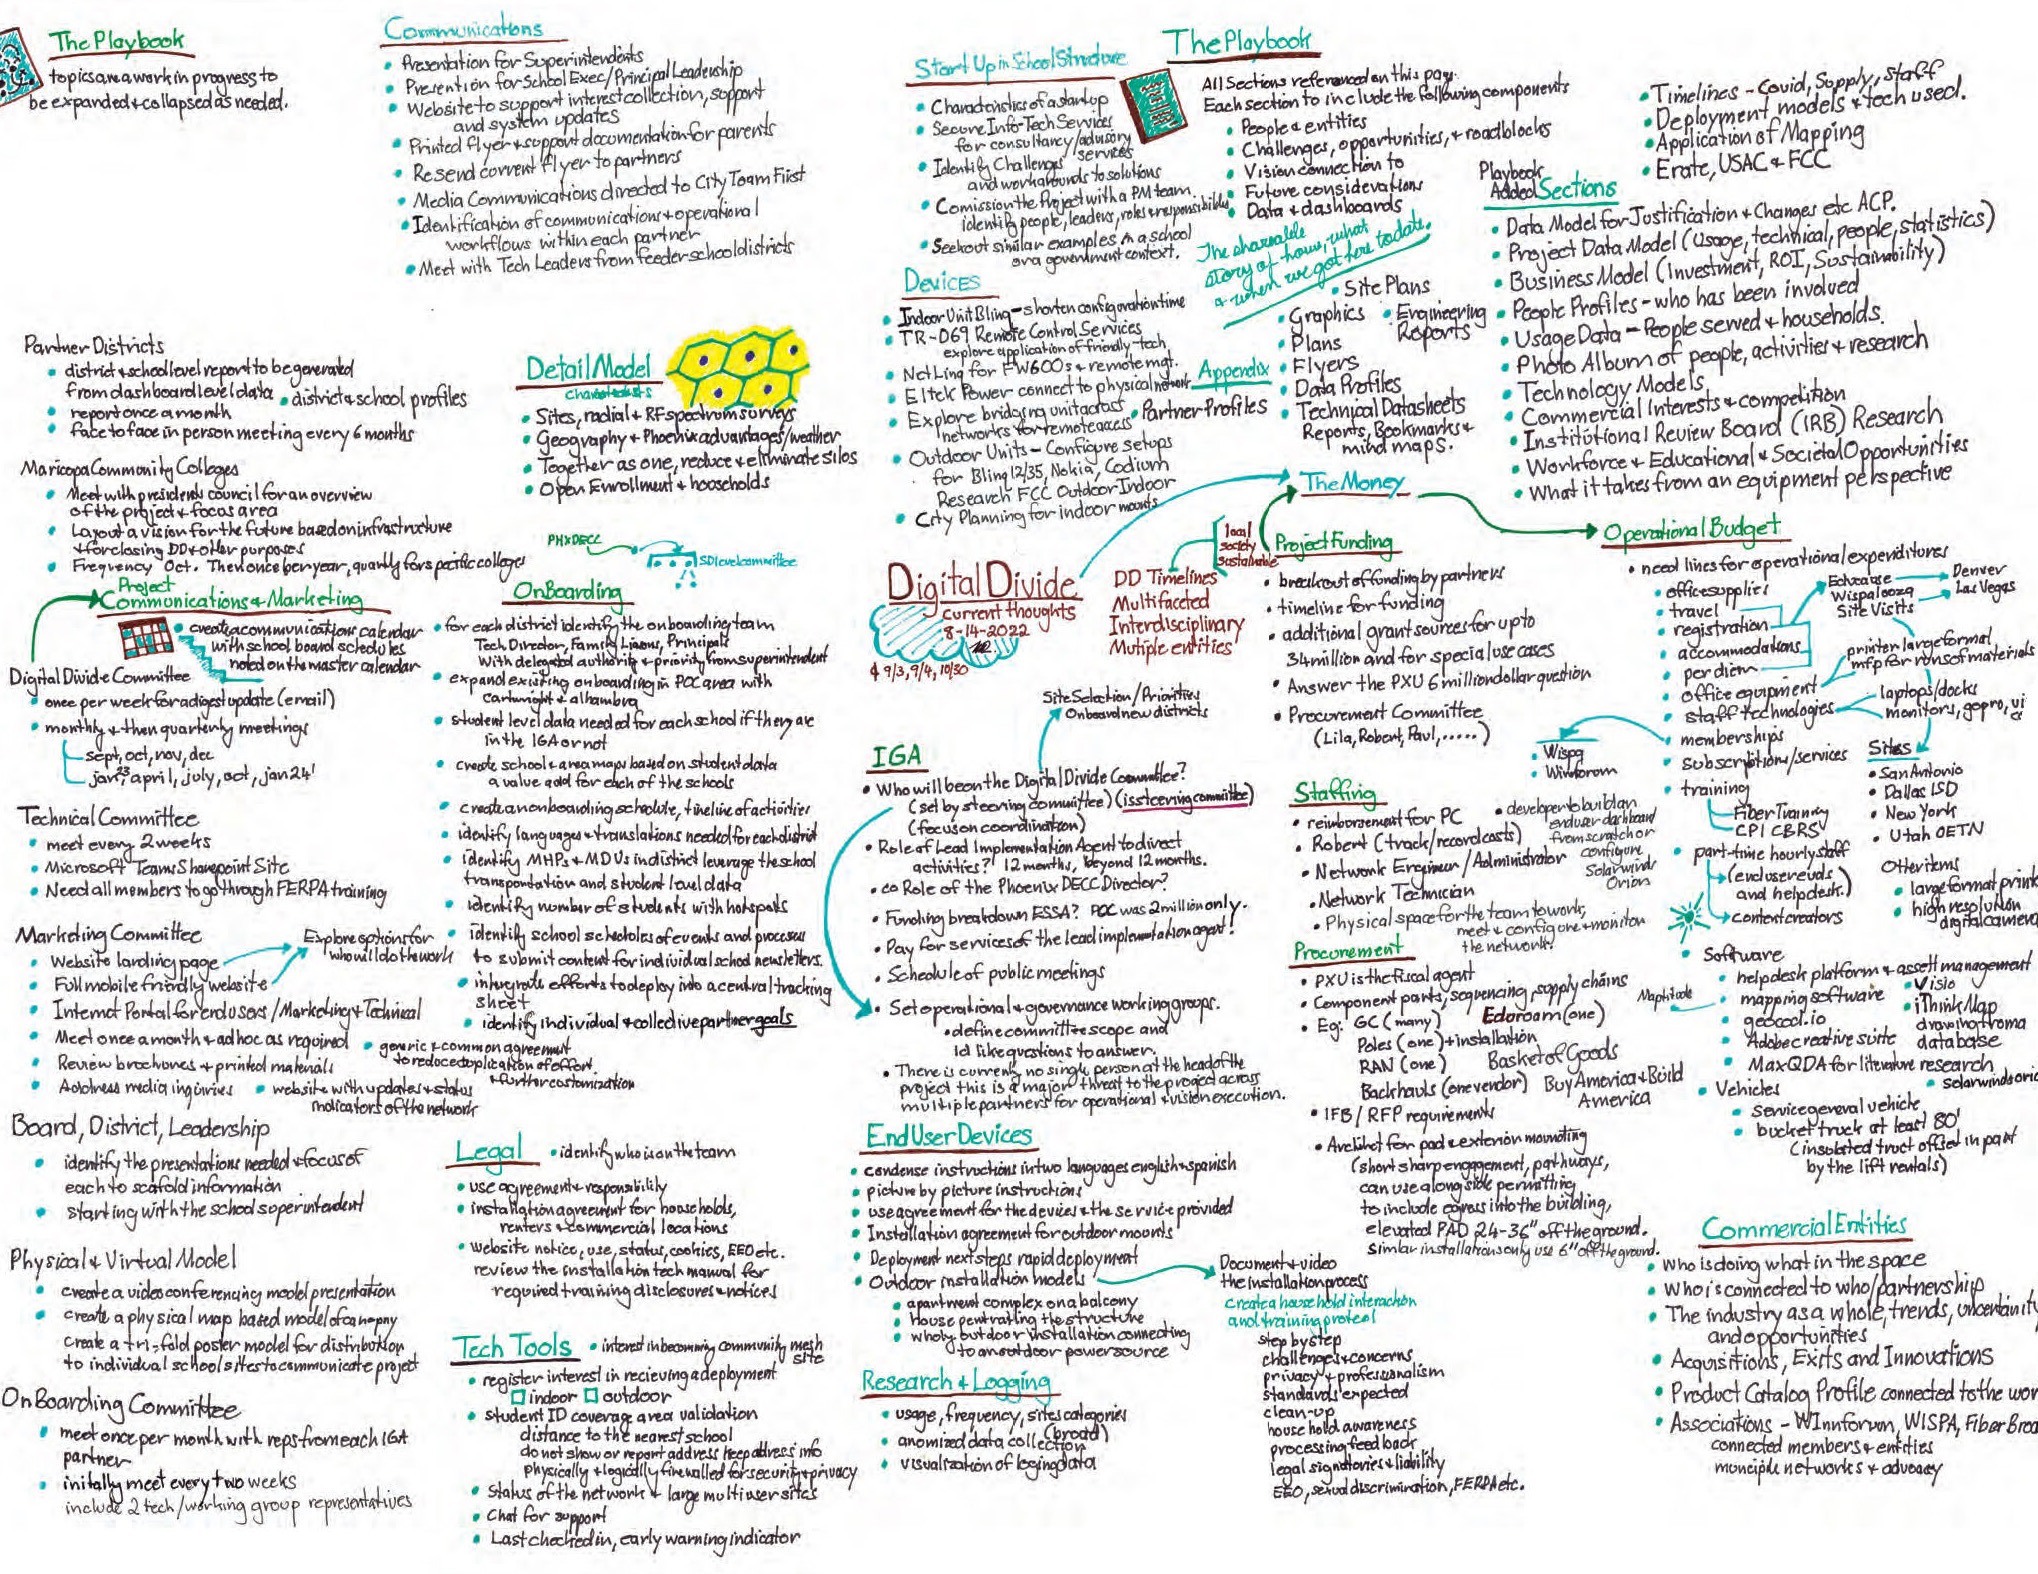
Operational mind map titled The Playbook with committees, communications, devices, staffing, procurement, and funding
DD Playbook. An operational memo translating digital-divide goals into coordinated implementation work.

From concern to coordination

The Playbook

The Playbook shifts from observing the problem to organizing a response. It maps governance, communications, partner districts, onboarding, devices, staffing, procurement, funding, legal responsibilities, end-user support, and research. The density reflects the practical reality that an initiative succeeds only when these workstreams move together.

How to read it: treat the center as the coordinating function and the surrounding sections as an implementation system. The map highlights dependencies often hidden behind a technology deployment, including committee roles, agreements, training, logistics, measurement, and long-term sustainability.

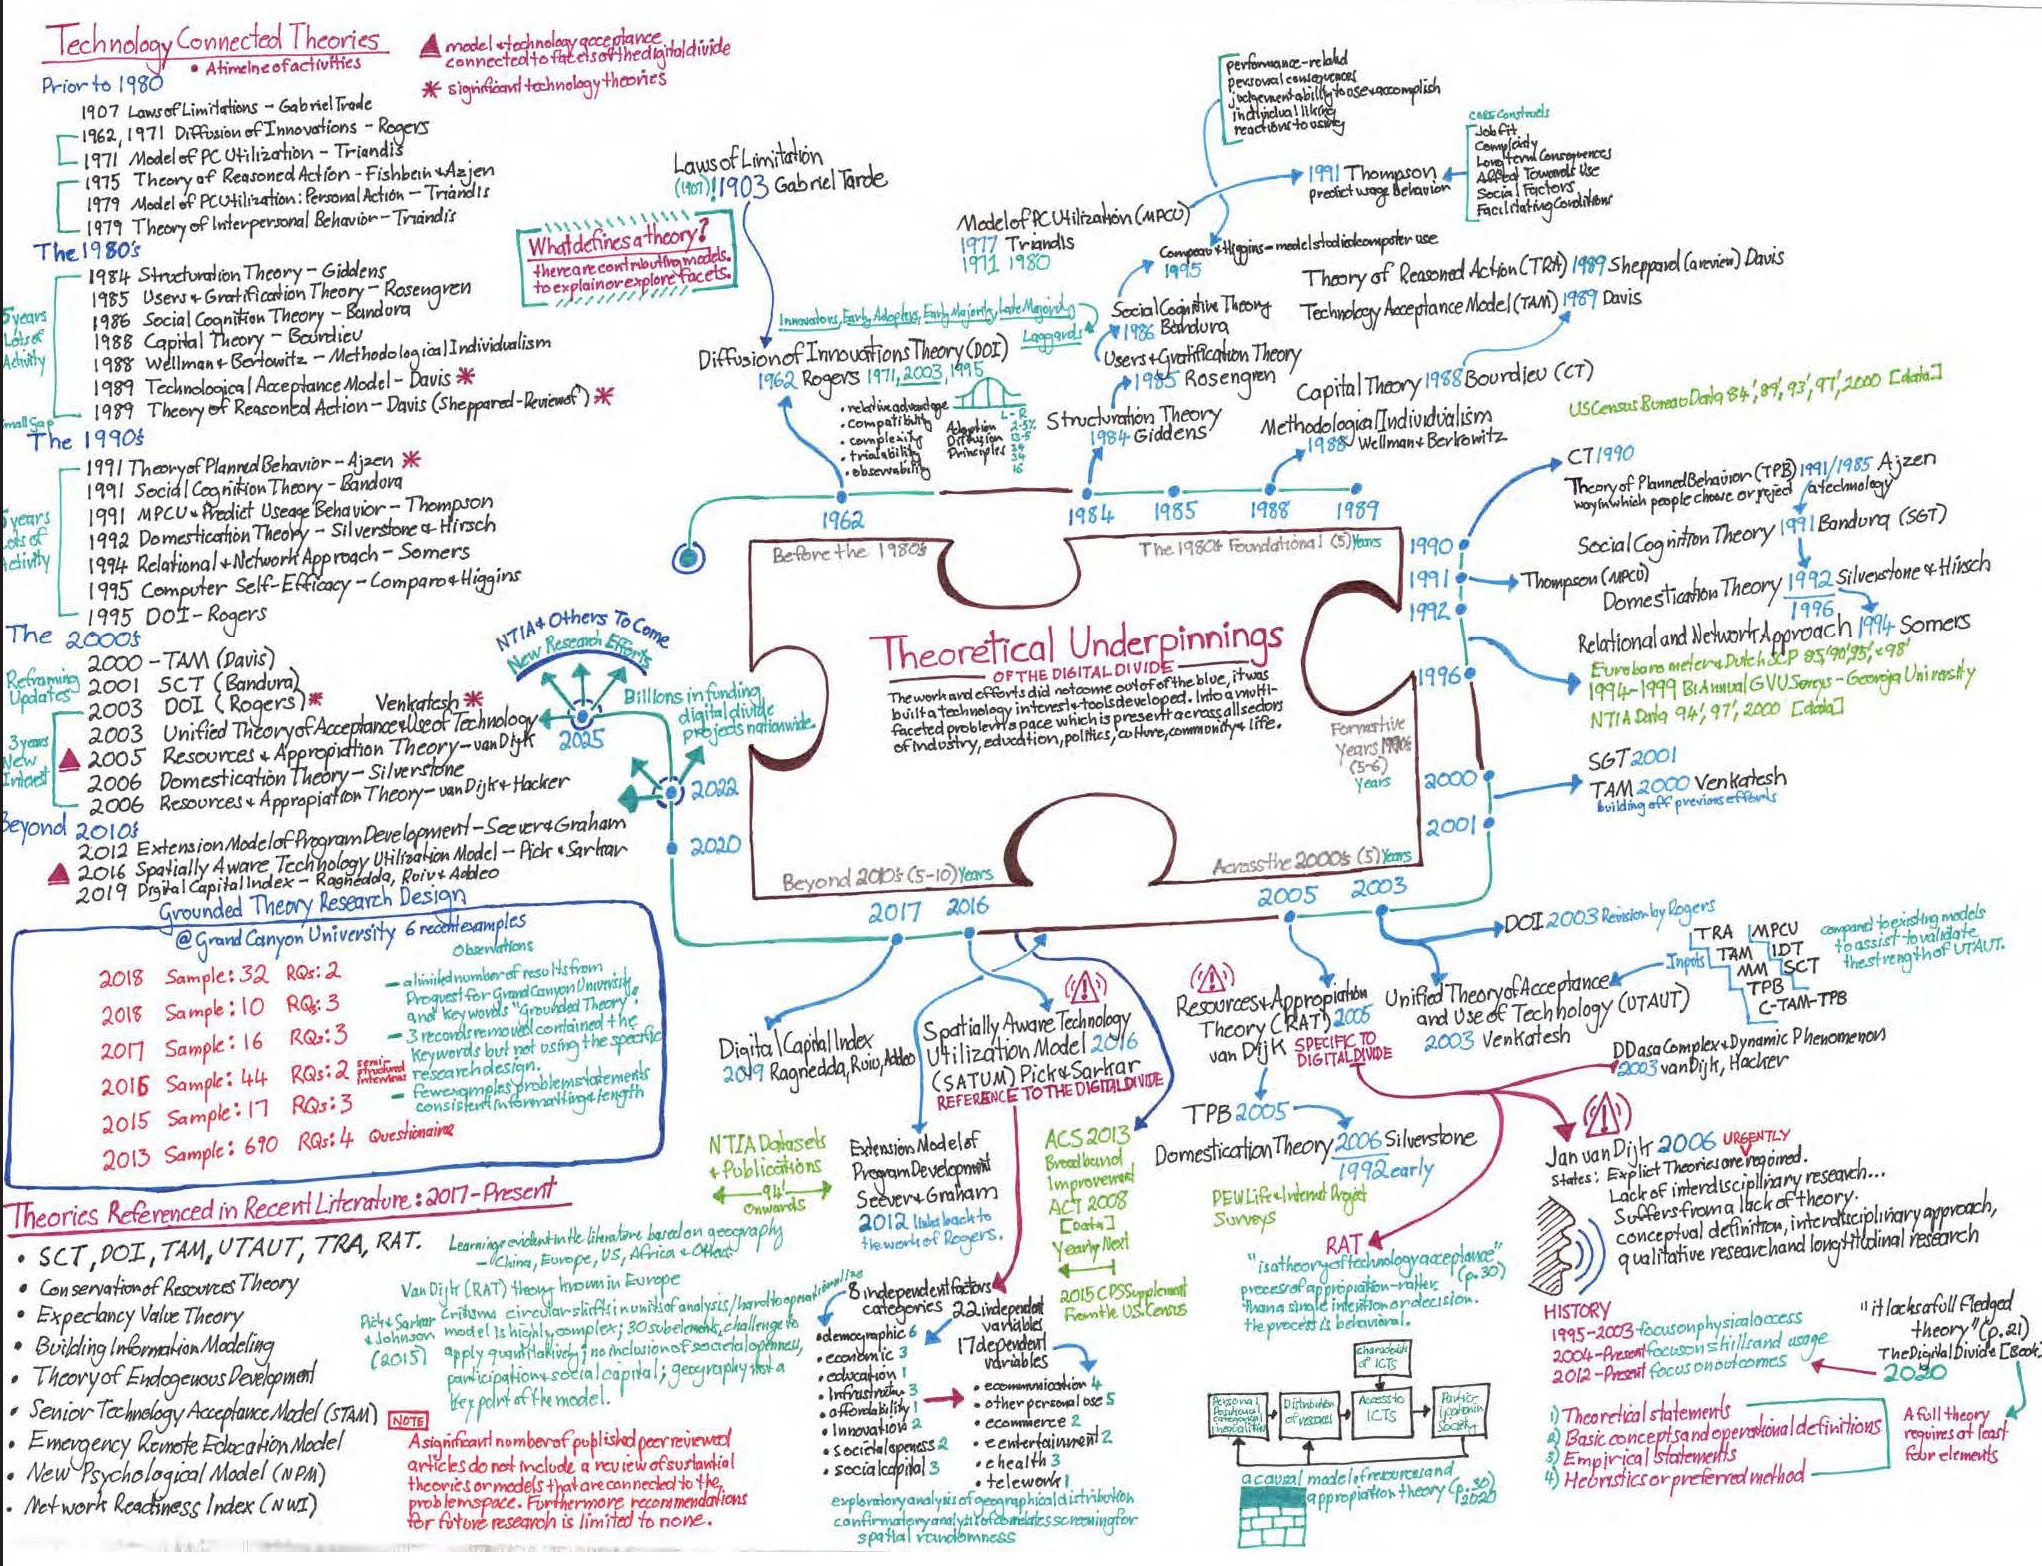
Timeline mind map of technology-connected theories and the theoretical underpinnings of the digital divide
DD Theories. A chronological and relational map of theories used to interpret technology access, adoption, and use.

Conceptual foundations

Technology-connected theories

This map places major theories of innovation, technology acceptance, planned behavior, social cognition, capital, domestication, resource appropriation, and spatially aware technology use along a timeline. The puzzle form at the center emphasizes that no single theory fully explains the digital divide.

How to read it: follow the timeline, then trace the branching arrows among related theories. The memo compares what each lens can illuminate—adoption, behavior, resources, social context, or geography—while also recording gaps that helped justify an emergent grounded theory.

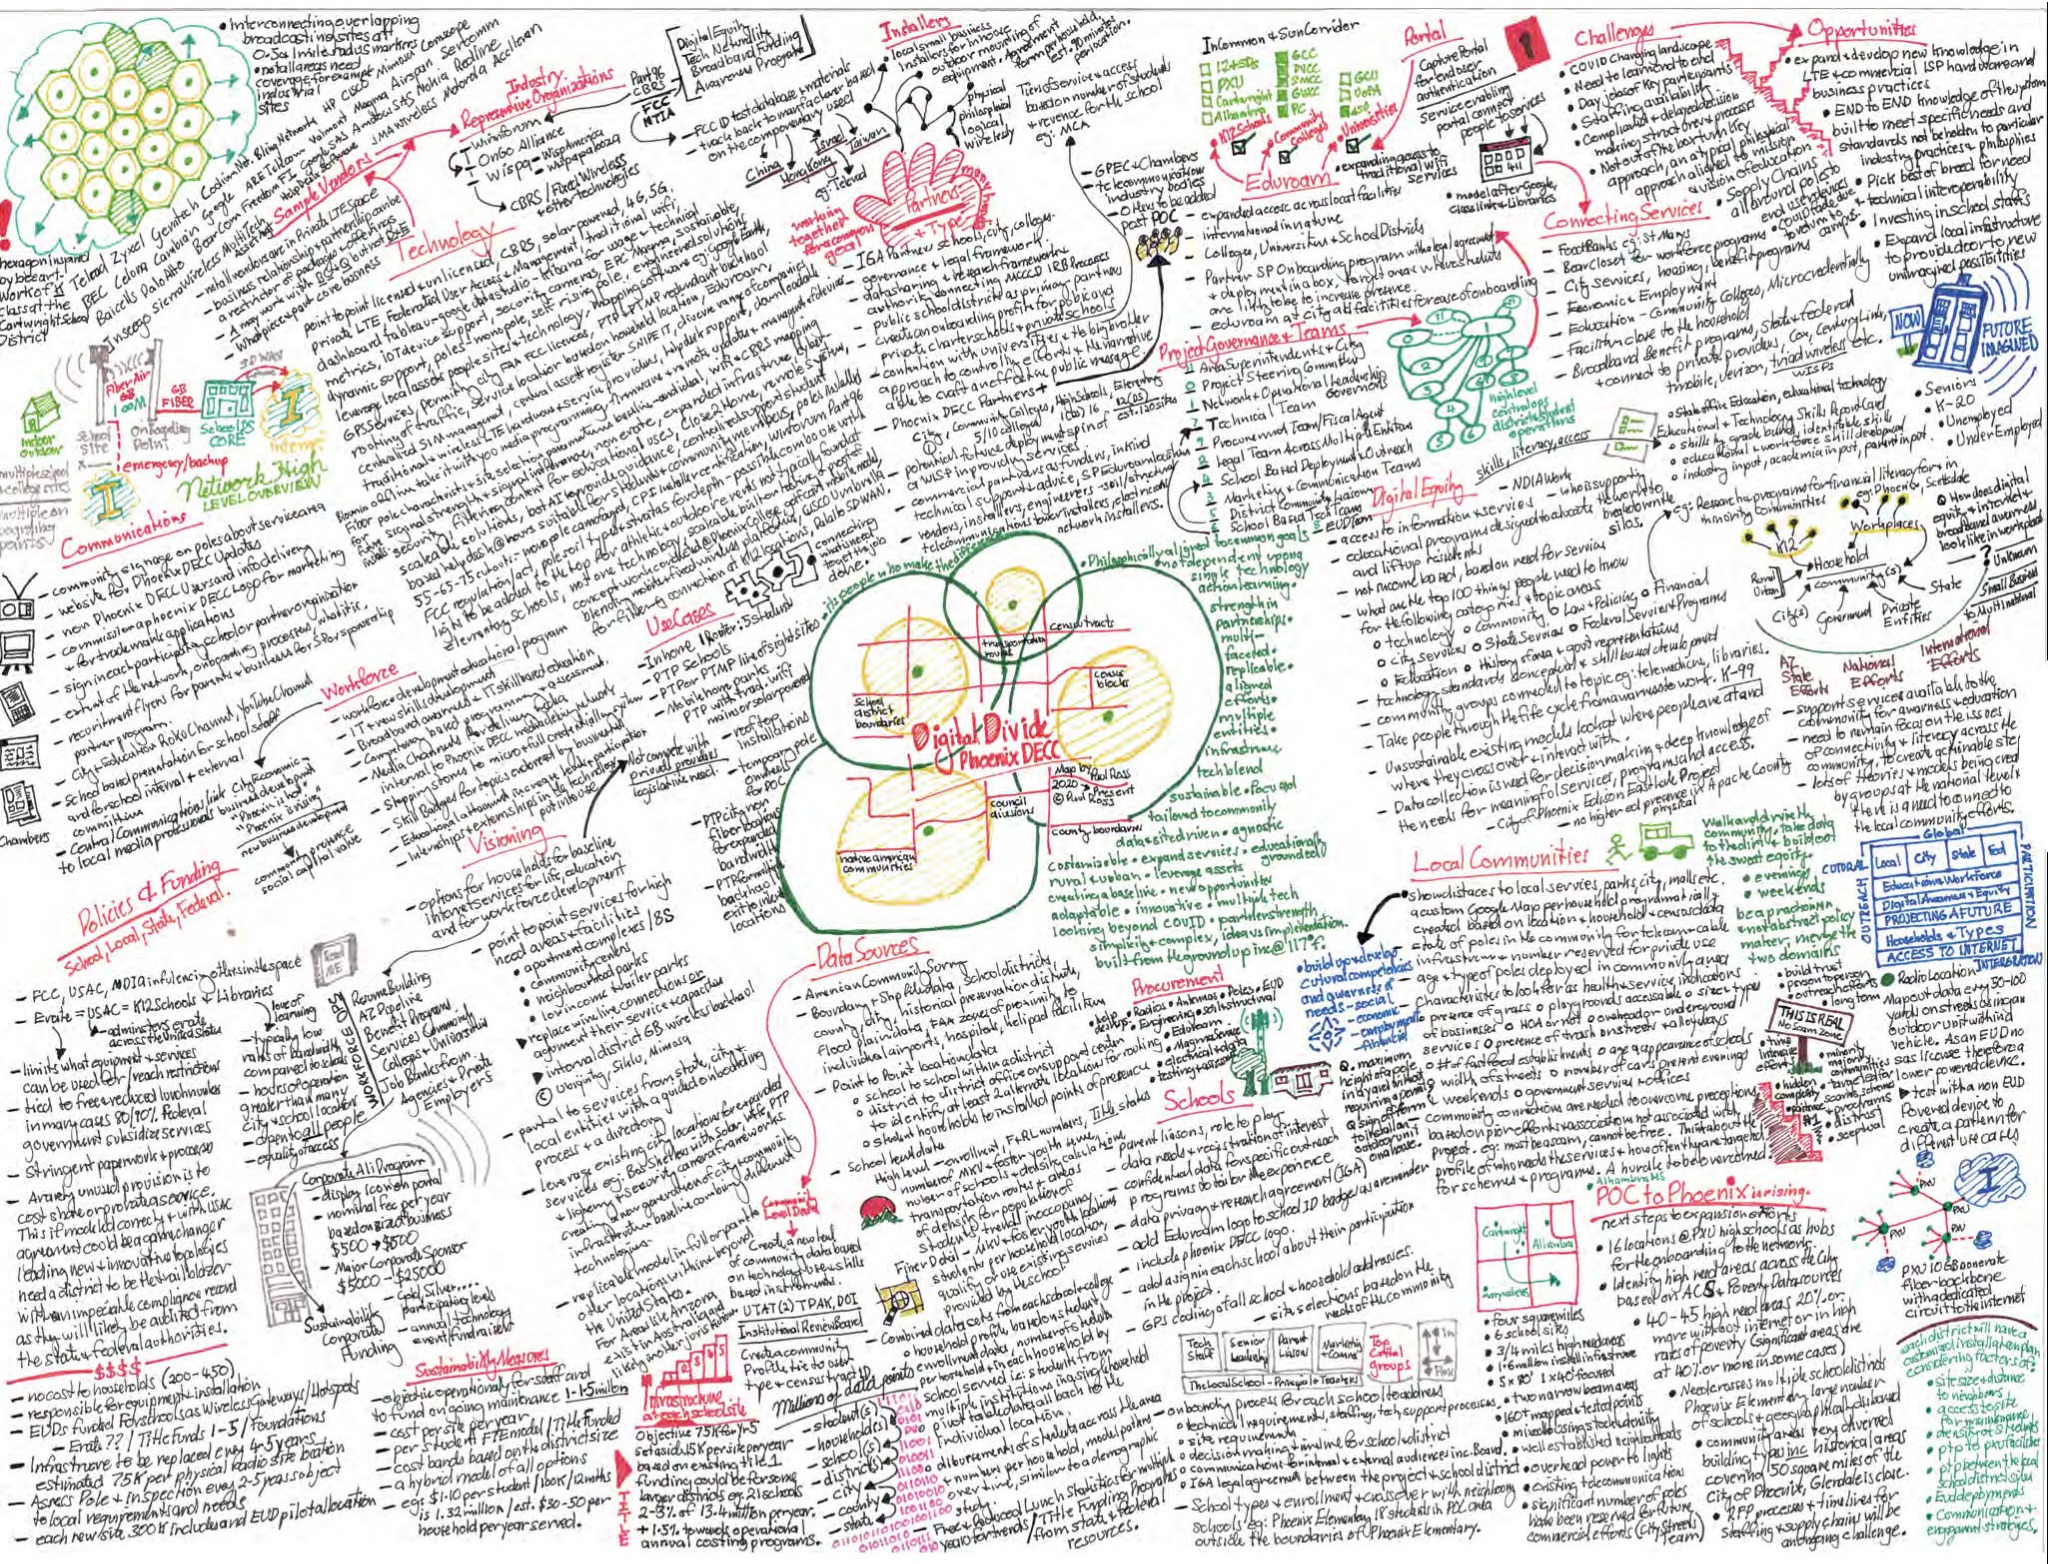
Detailed Phoenix digital divide ecosystem map covering infrastructure, governance, education, community, and industry
DD Phoenix. A place-based systems map connecting regional assets, institutions, needs, and implementation choices.

Place-based systems

Phoenix ecosystem

The Phoenix map grounds the inquiry in a specific metropolitan context. It connects infrastructure and wireless technologies with schools, colleges, libraries, municipalities, community organizations, employers, funders, procurement, and regulatory conditions. The central project diagram frames a local initiative as the meeting point of overlapping systems rather than a standalone network.

How to read it: move between the technical material on the left and the community and institutional material on the right. The map shows why effective responses must be locally assembled from relationships, assets, governance, data, and the distinct needs of households and neighborhoods.

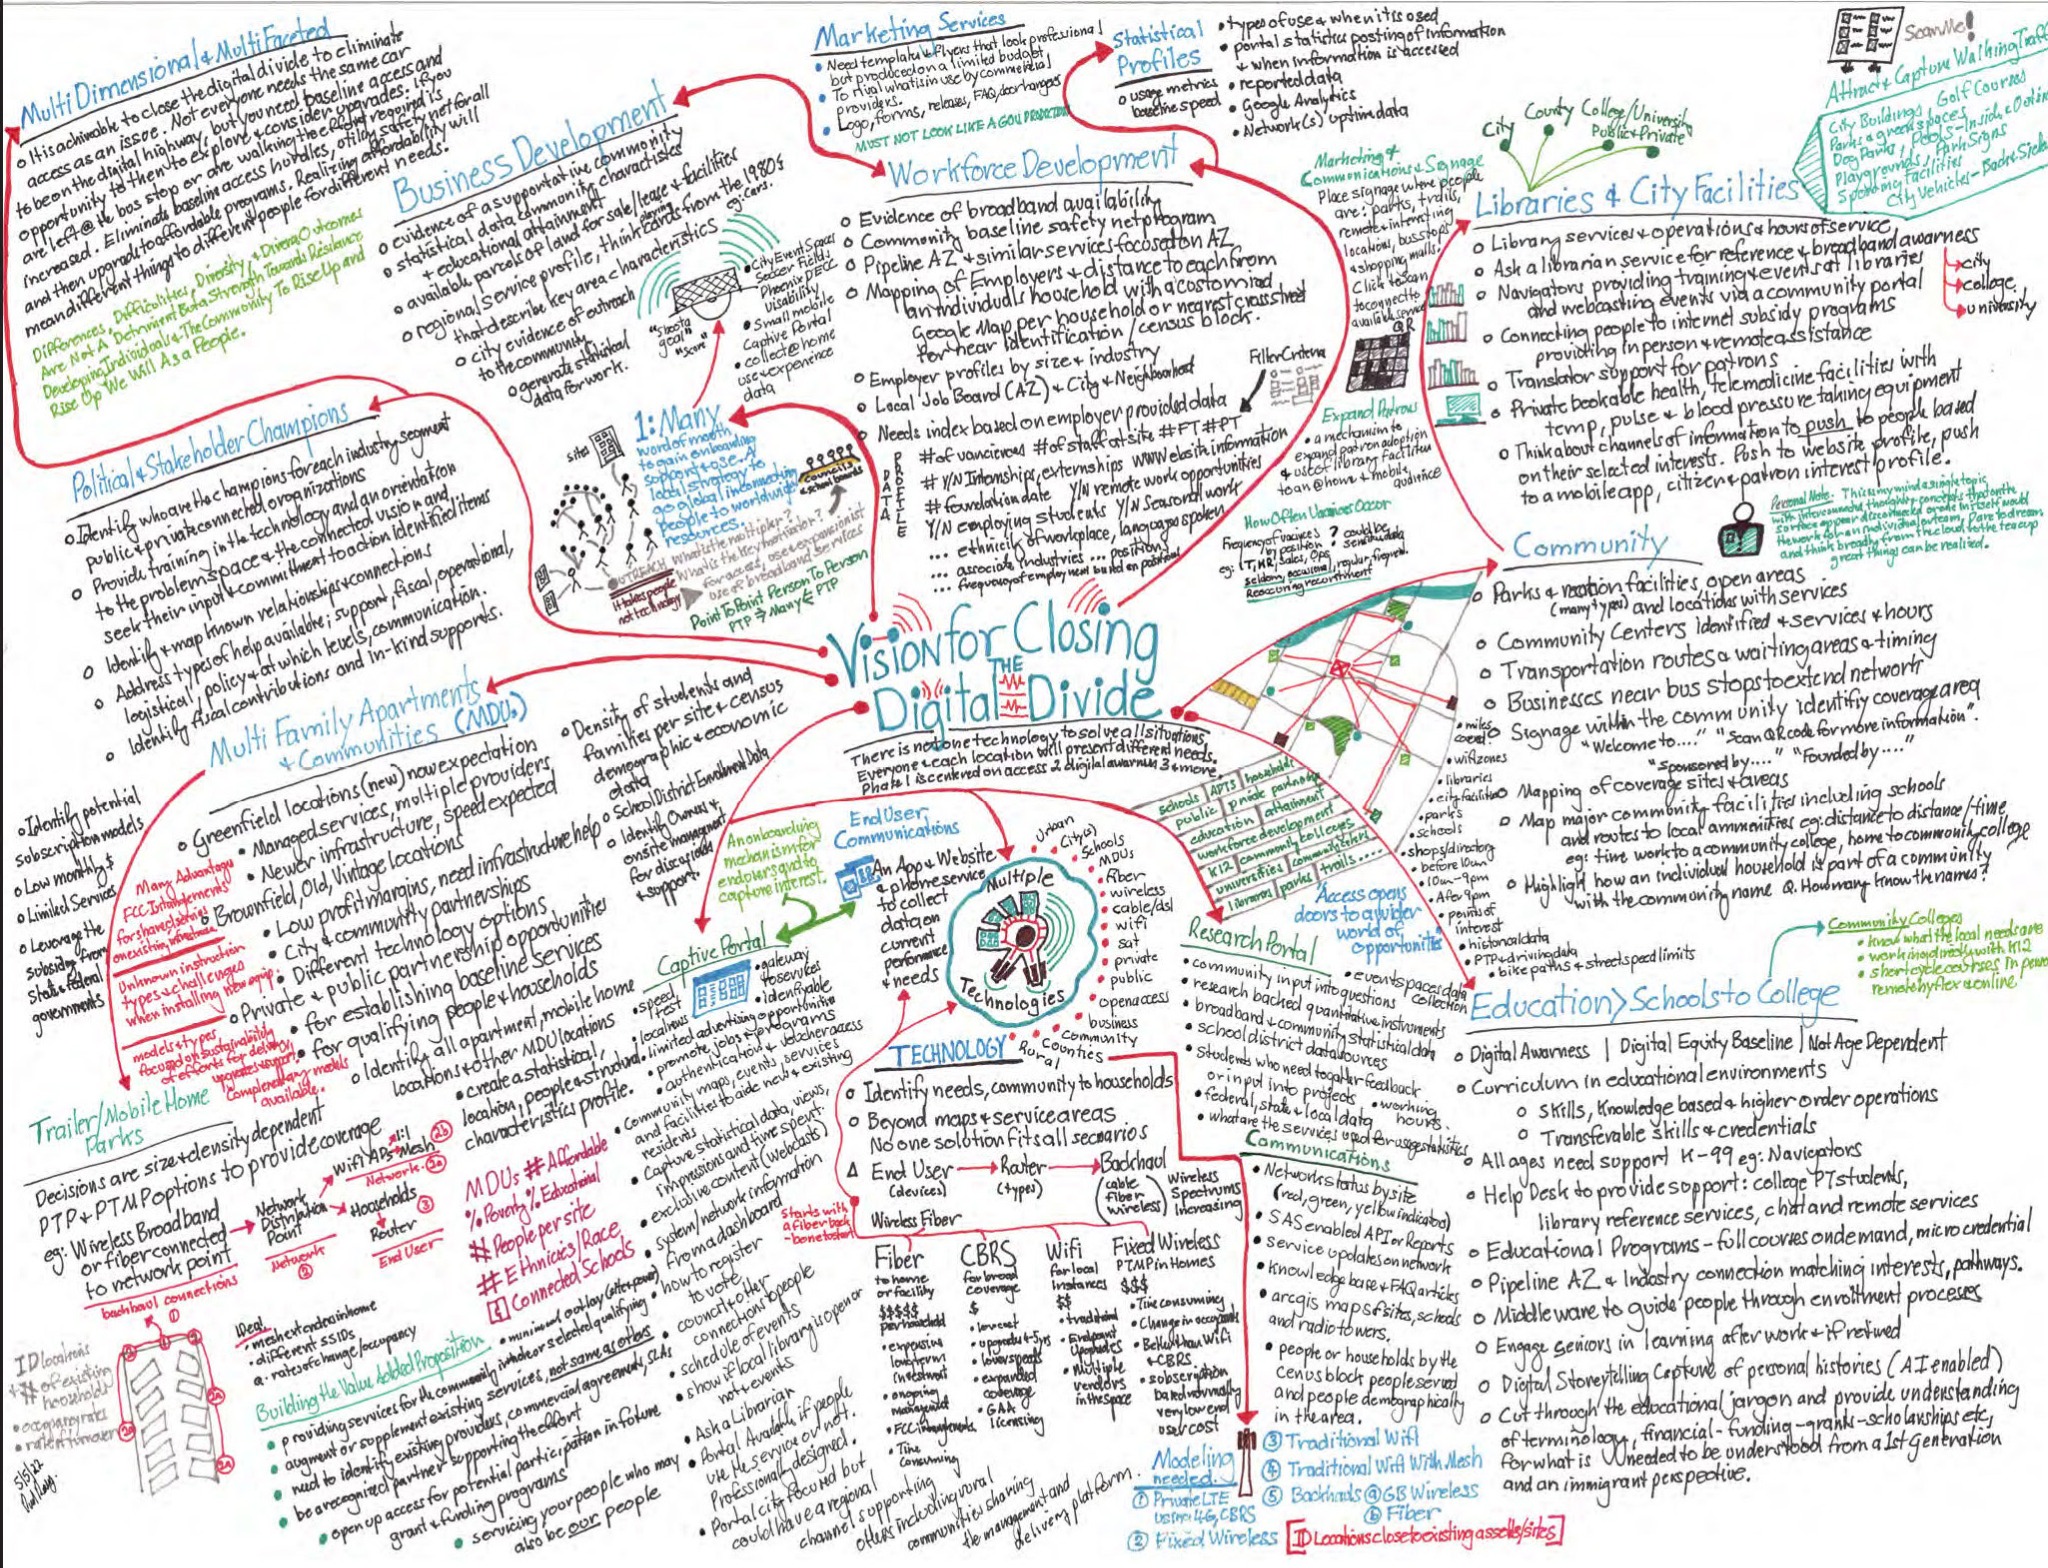
Vision for Closing the Digital Divide mind map connecting communities, education, workforce, technology, and stakeholders
Vision for Closing the Digital Divide. A future-facing map of the capabilities and partnerships needed for sustained participation.

A connected vision

Vision for closing the divide

This memo organizes a forward-looking response around communities, education, workforce development, business, libraries, political and stakeholder champions, housing, communications, data, and multiple access technologies. At its center is a reminder that technology alone cannot solve the problem; solutions must respond to different people, places, and purposes.

How to read it: follow the red pathways from the central vision into social settings and the green pathways into enabling systems. Together they describe a portfolio of solutions in which technology choice follows context and access becomes a route to learning, work, services, and community participation.

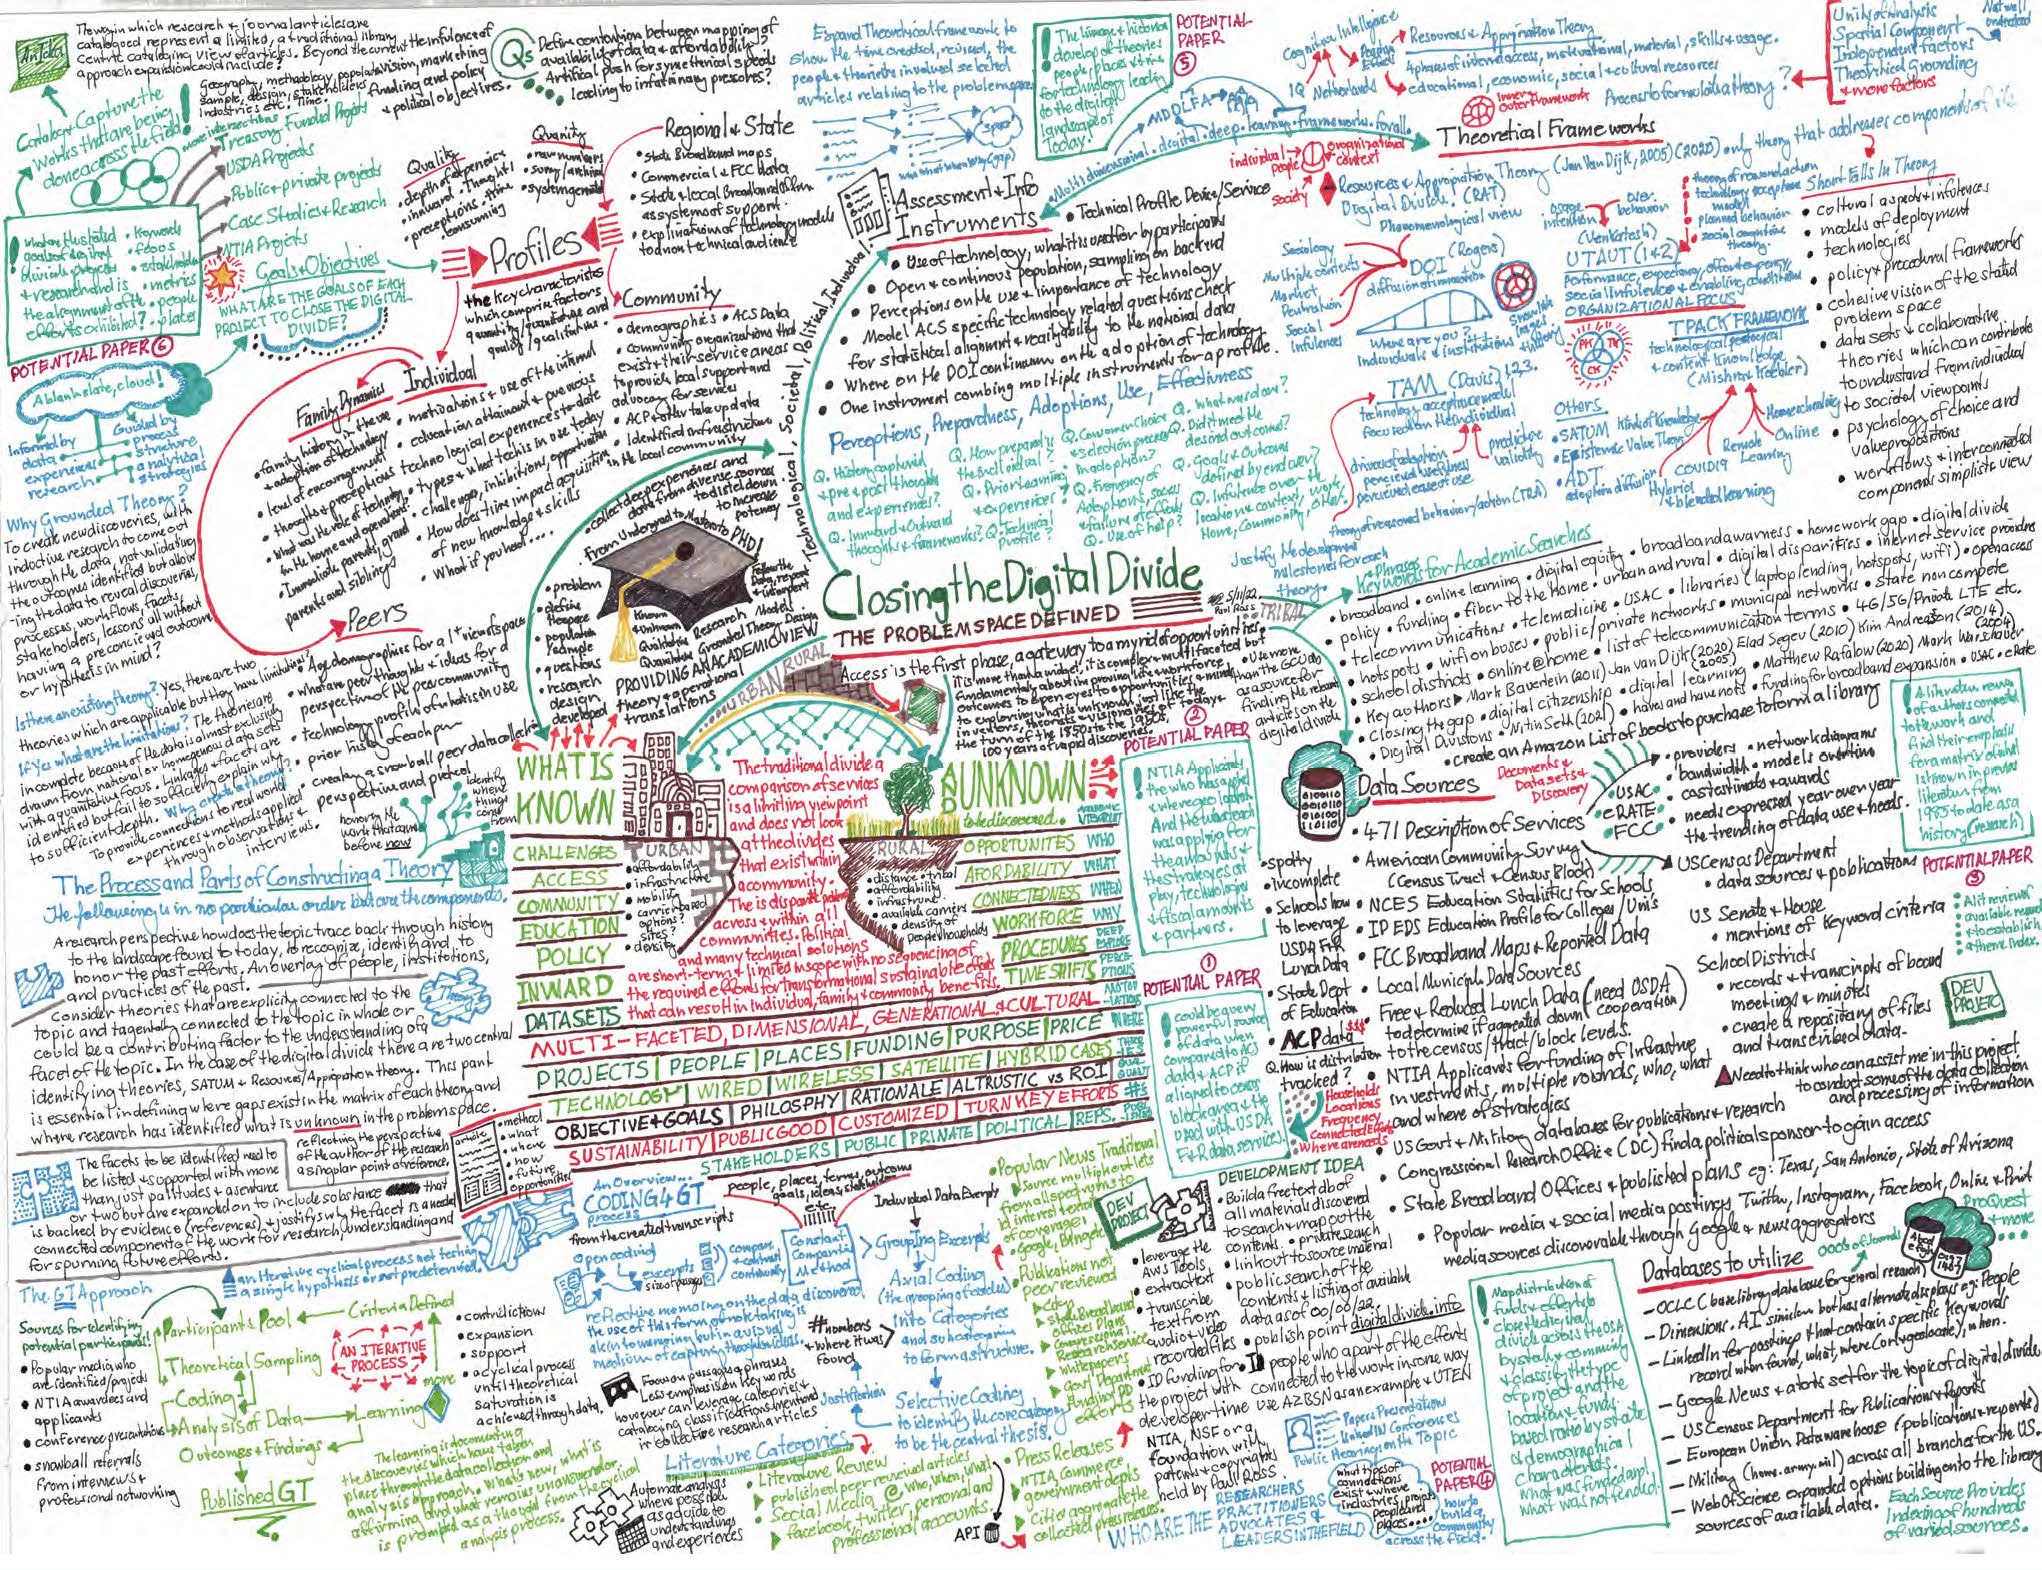
Closing the Digital Divide problem-space mind map with known and unknown dimensions, theories, data sources, profiles, and grounded theory methods
DD Problem Space. A research-design memo integrating the known, the unknown, theory, evidence, and method.

Research architecture

The problem space

The final map in the sequence consolidates the research terrain. It distinguishes established knowledge from unresolved questions and brings together profiles, instruments, theoretical frameworks, data sources, literature, practitioner knowledge, and grounded theory methods. Urban, rural, individual, institutional, and community dimensions are deliberately held in the same field.

How to read it: start with the central known–unknown divide, then move outward toward theory and evidence. The map records the bridge from a broad, multidimensional problem to a research process capable of comparing experiences, identifying categories, and building an explanatory model beyond access alone.

Smaller visual memos

Field notes and working sketches

These smaller-format pages capture focused questions, emerging models, implementation tasks, and stakeholder relationships. Their compact card treatment distinguishes them from the six large synthesis maps while preserving each page as an expandable research artifact.

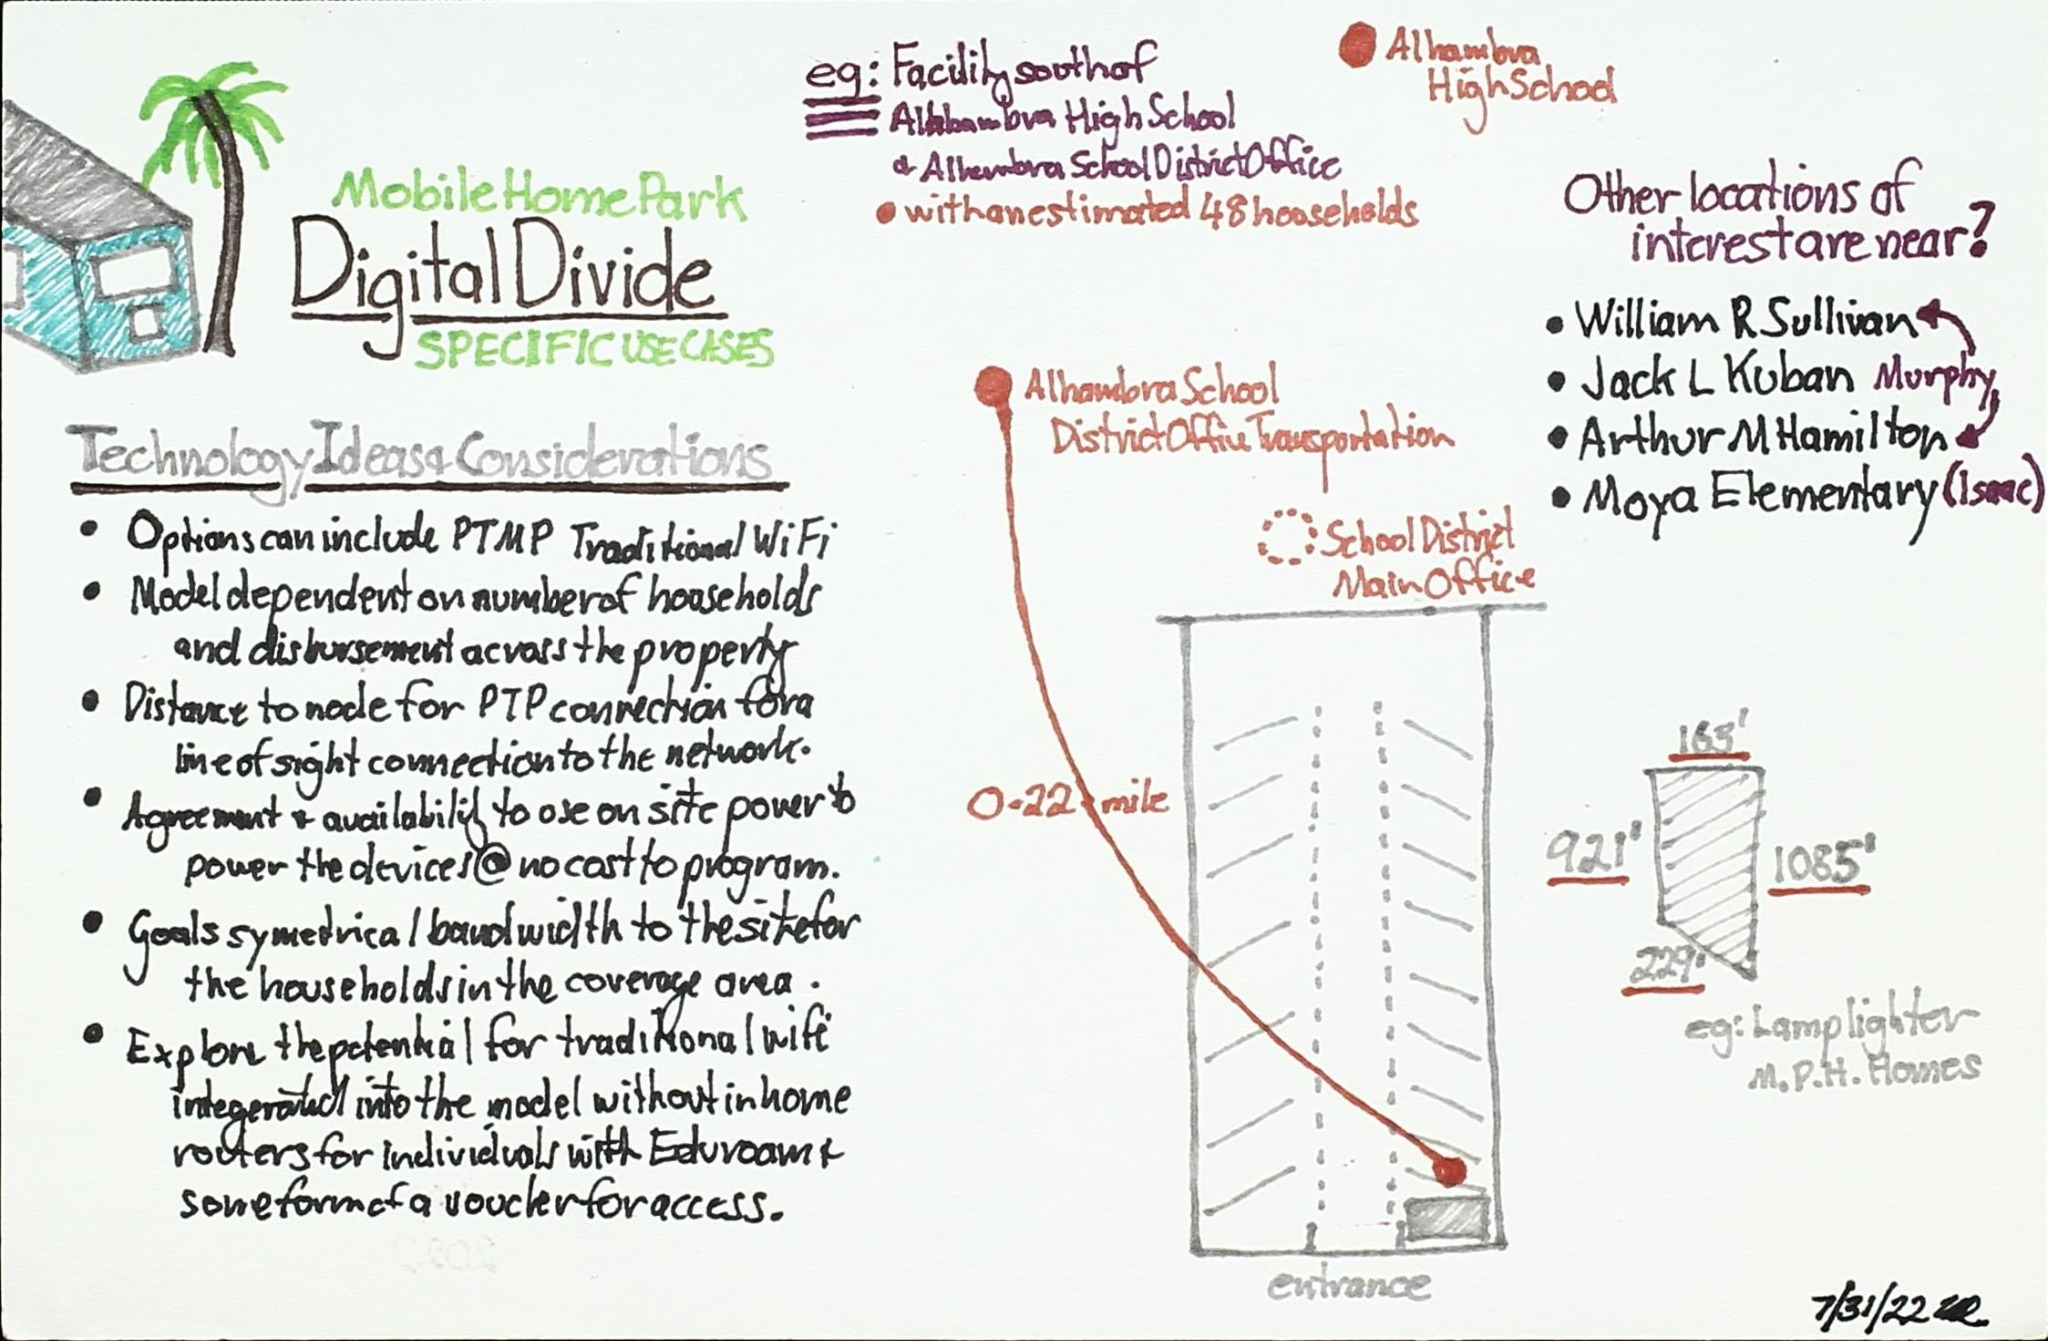
Mobile home park digital-divide sketch with technology ideas and a coverage drawing
Access setting

Mobile home park use cases

Explores localized connectivity options, potential pilot sites, technology choices, and the physical reach of service.

Research sketch connecting needs, access, schools, households, and implementation questions
Needs discovery

Access and end-user needs

Collects questions about who needs service, where gaps occur, and how schools and community partners might respond.

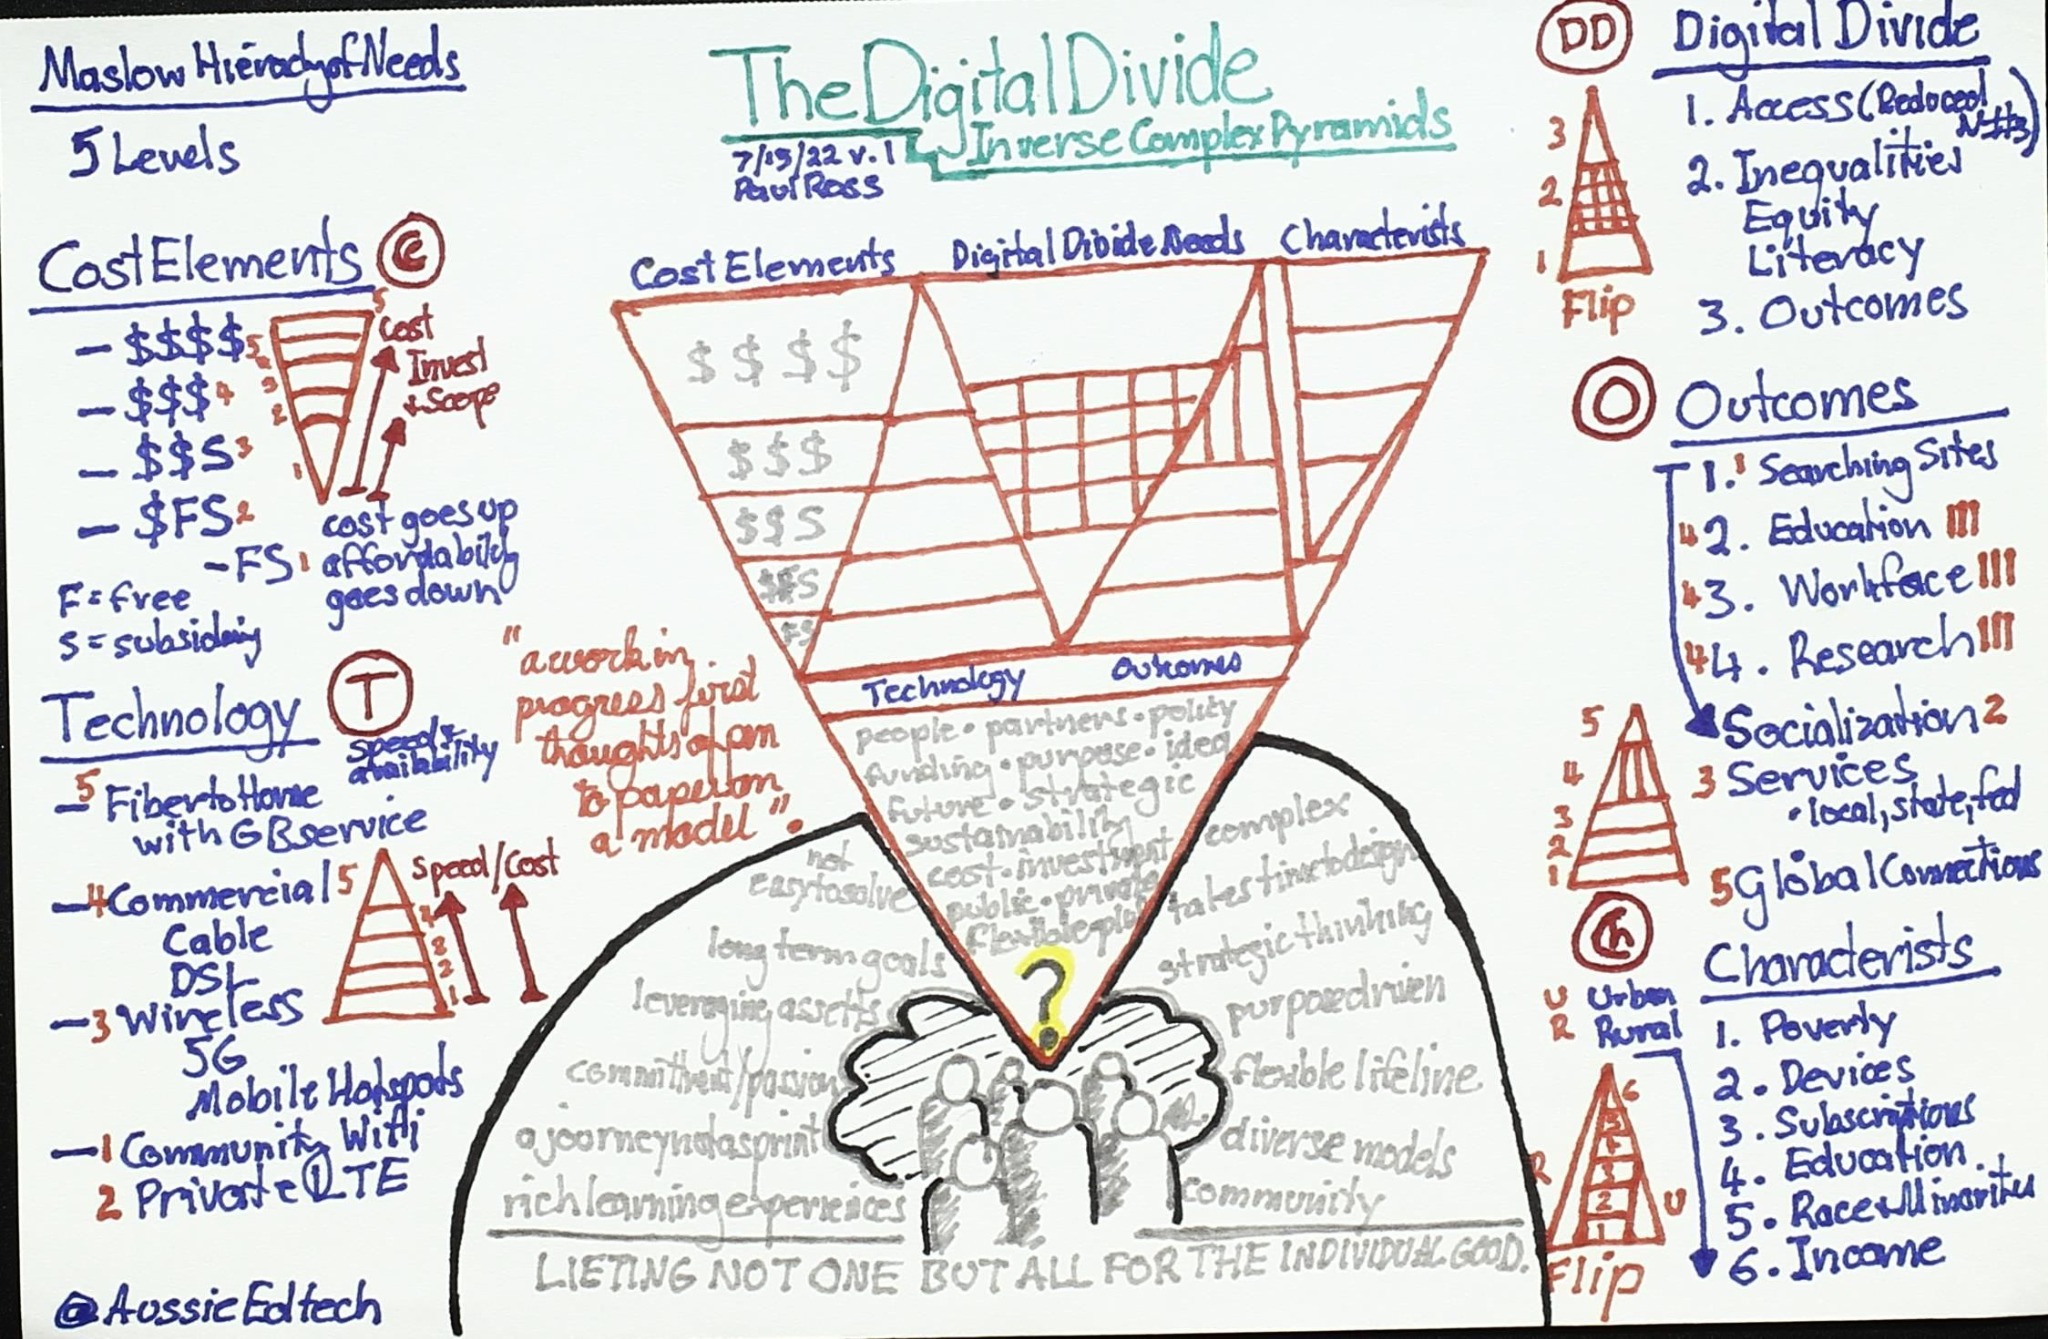
Digital-divide pyramid sketch linking needs, cost, technology, characteristics, outcomes, and challenges
Framework sketch

The digital-divide pyramid

Layers access needs, costs, technology, characteristics, outcomes, and persistent challenges into an early visual framework.

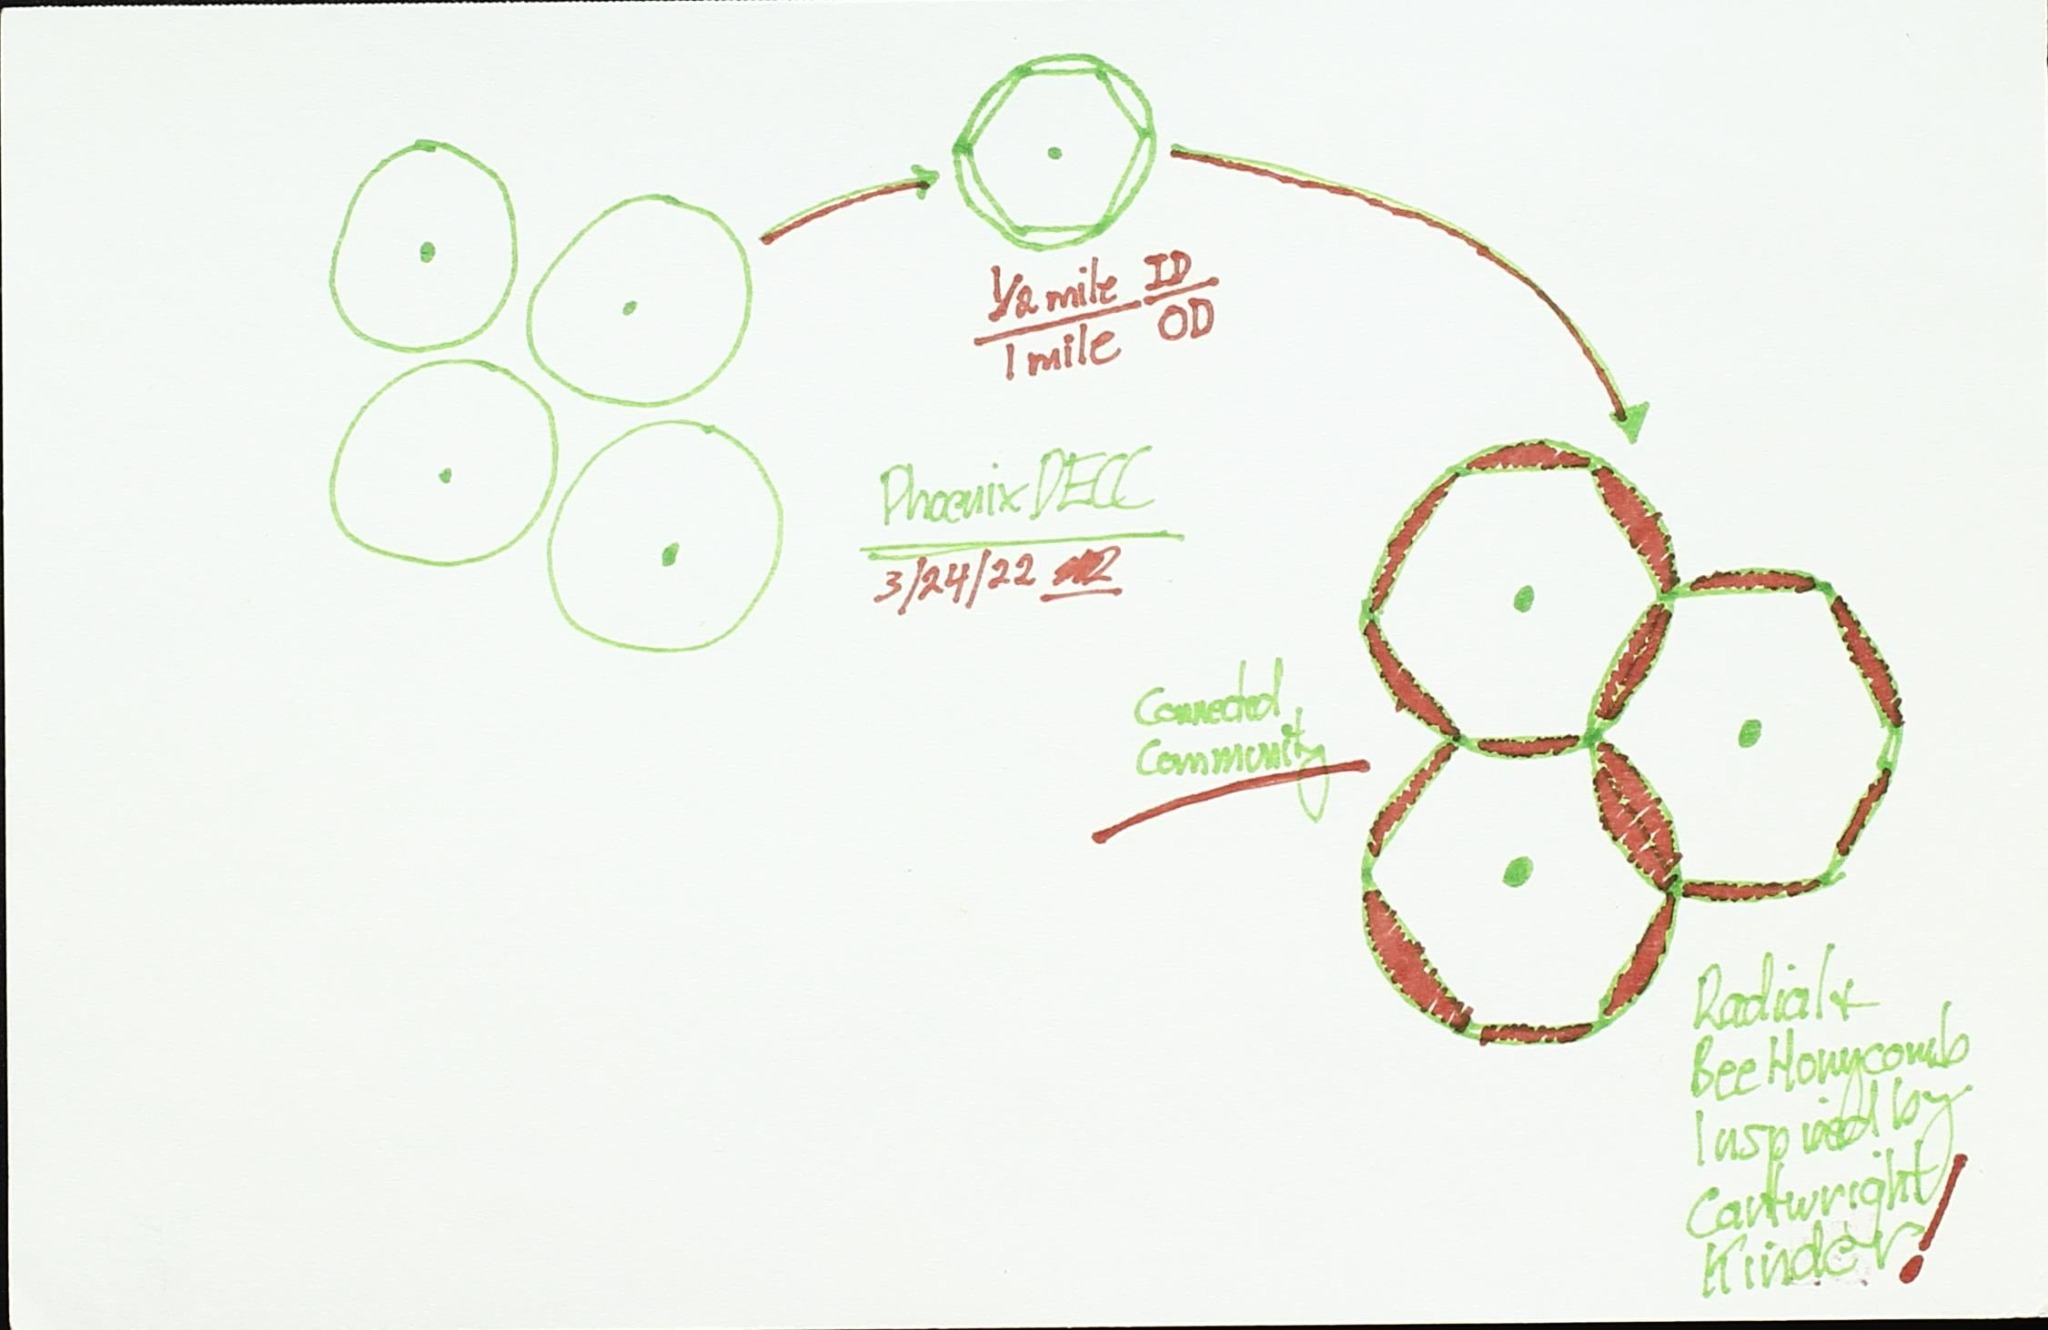
Small hand-drawn cluster diagram showing an early Phoenix model concept
Early model

Phoenix model iteration

A minimal working sketch testing how overlapping components might form a grounded conceptual model.

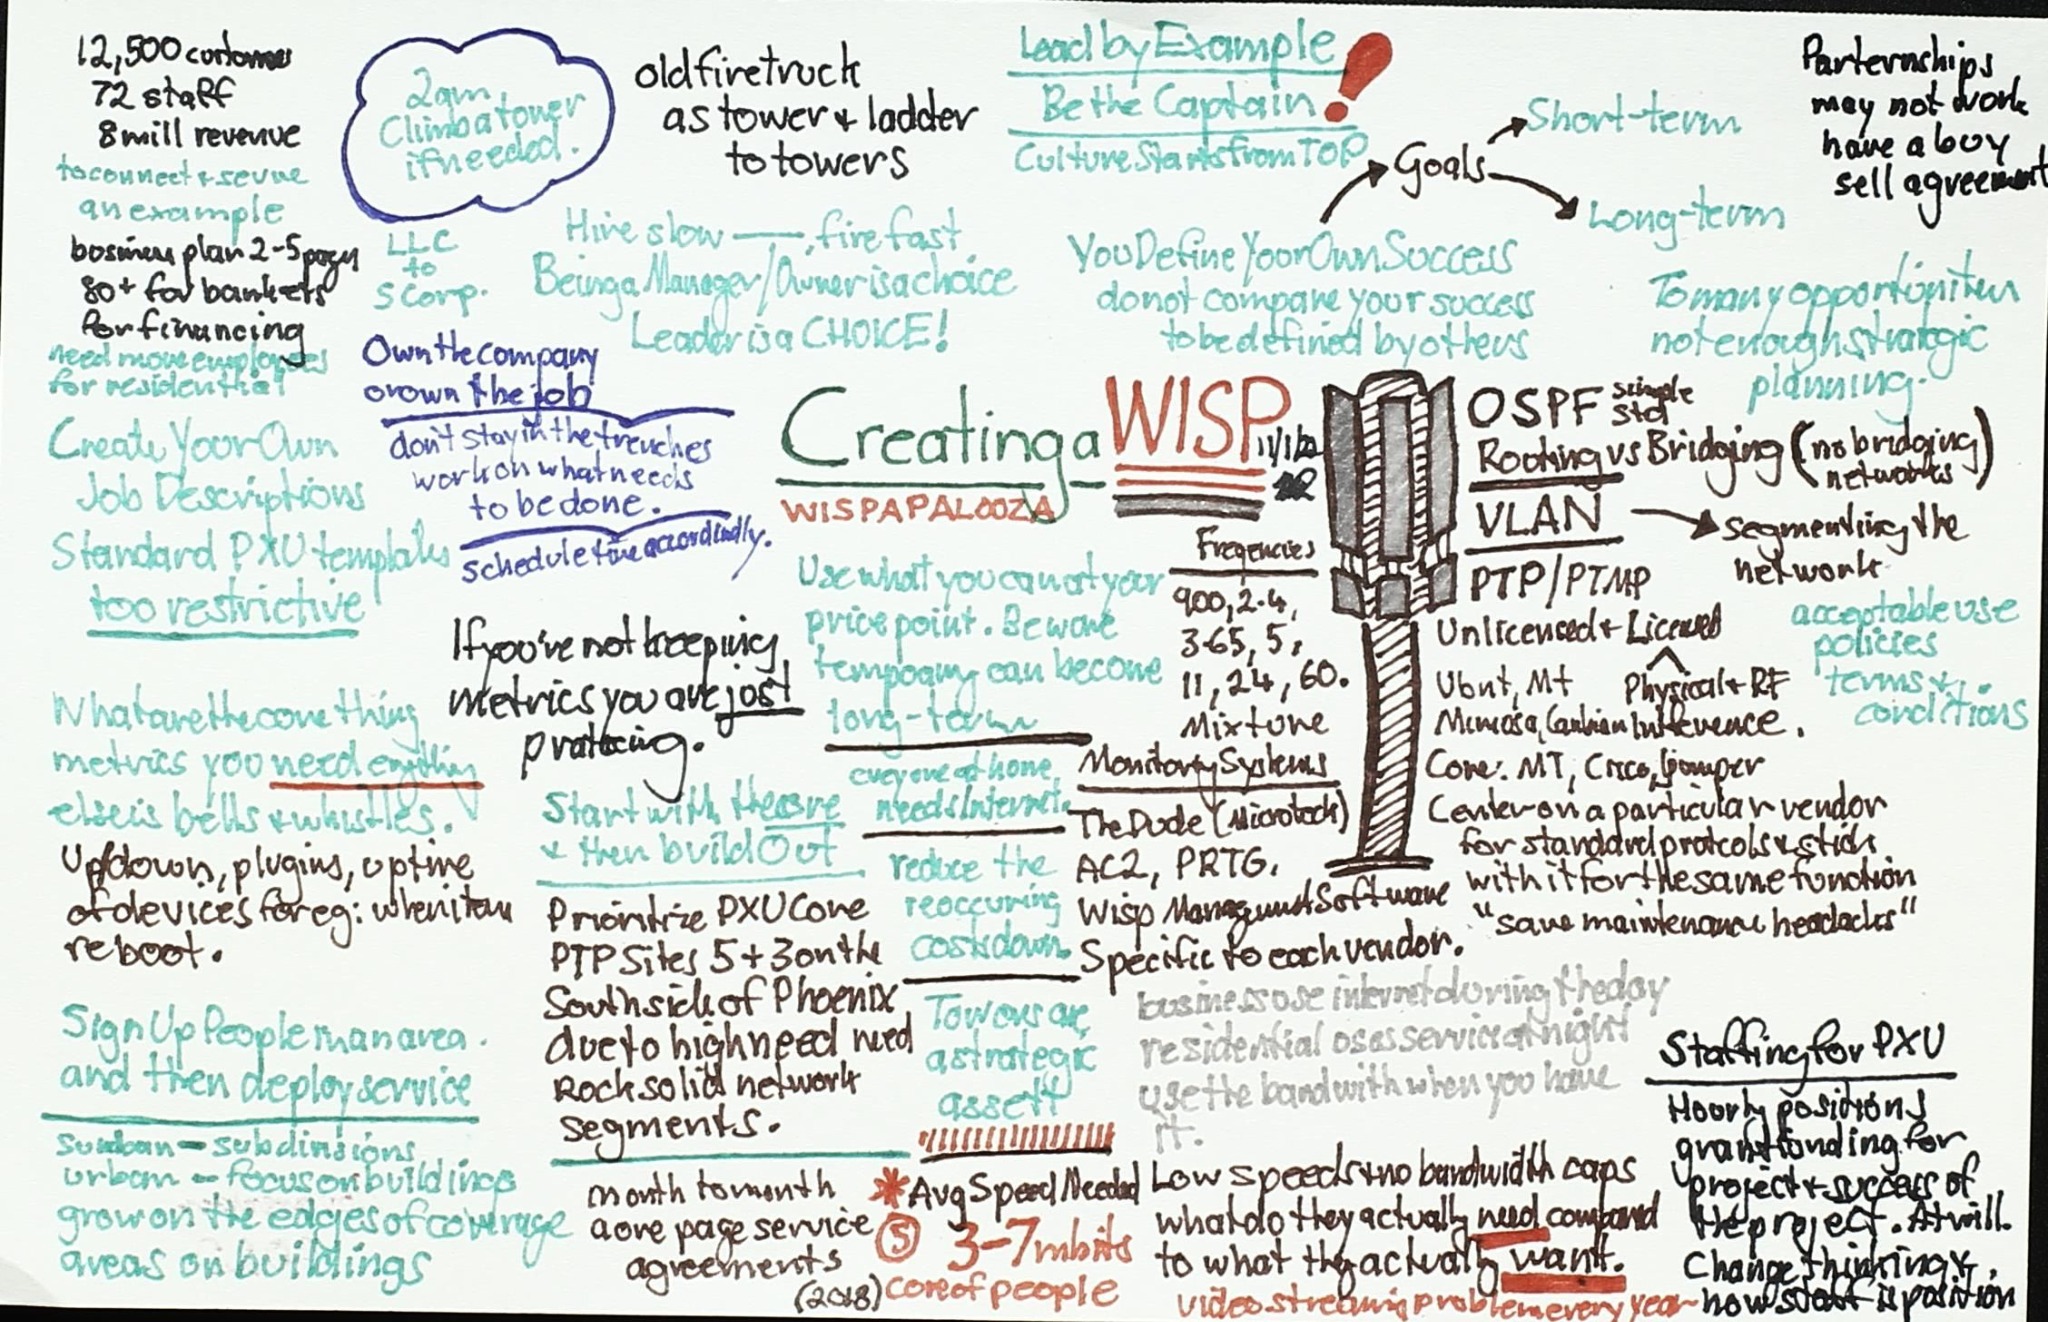
Creating a WISP planning memo with network, governance, sustainability, and community considerations
Implementation

Creating a WISP

Maps the technical, governance, funding, sustainability, and community decisions involved in developing a wireless ISP.

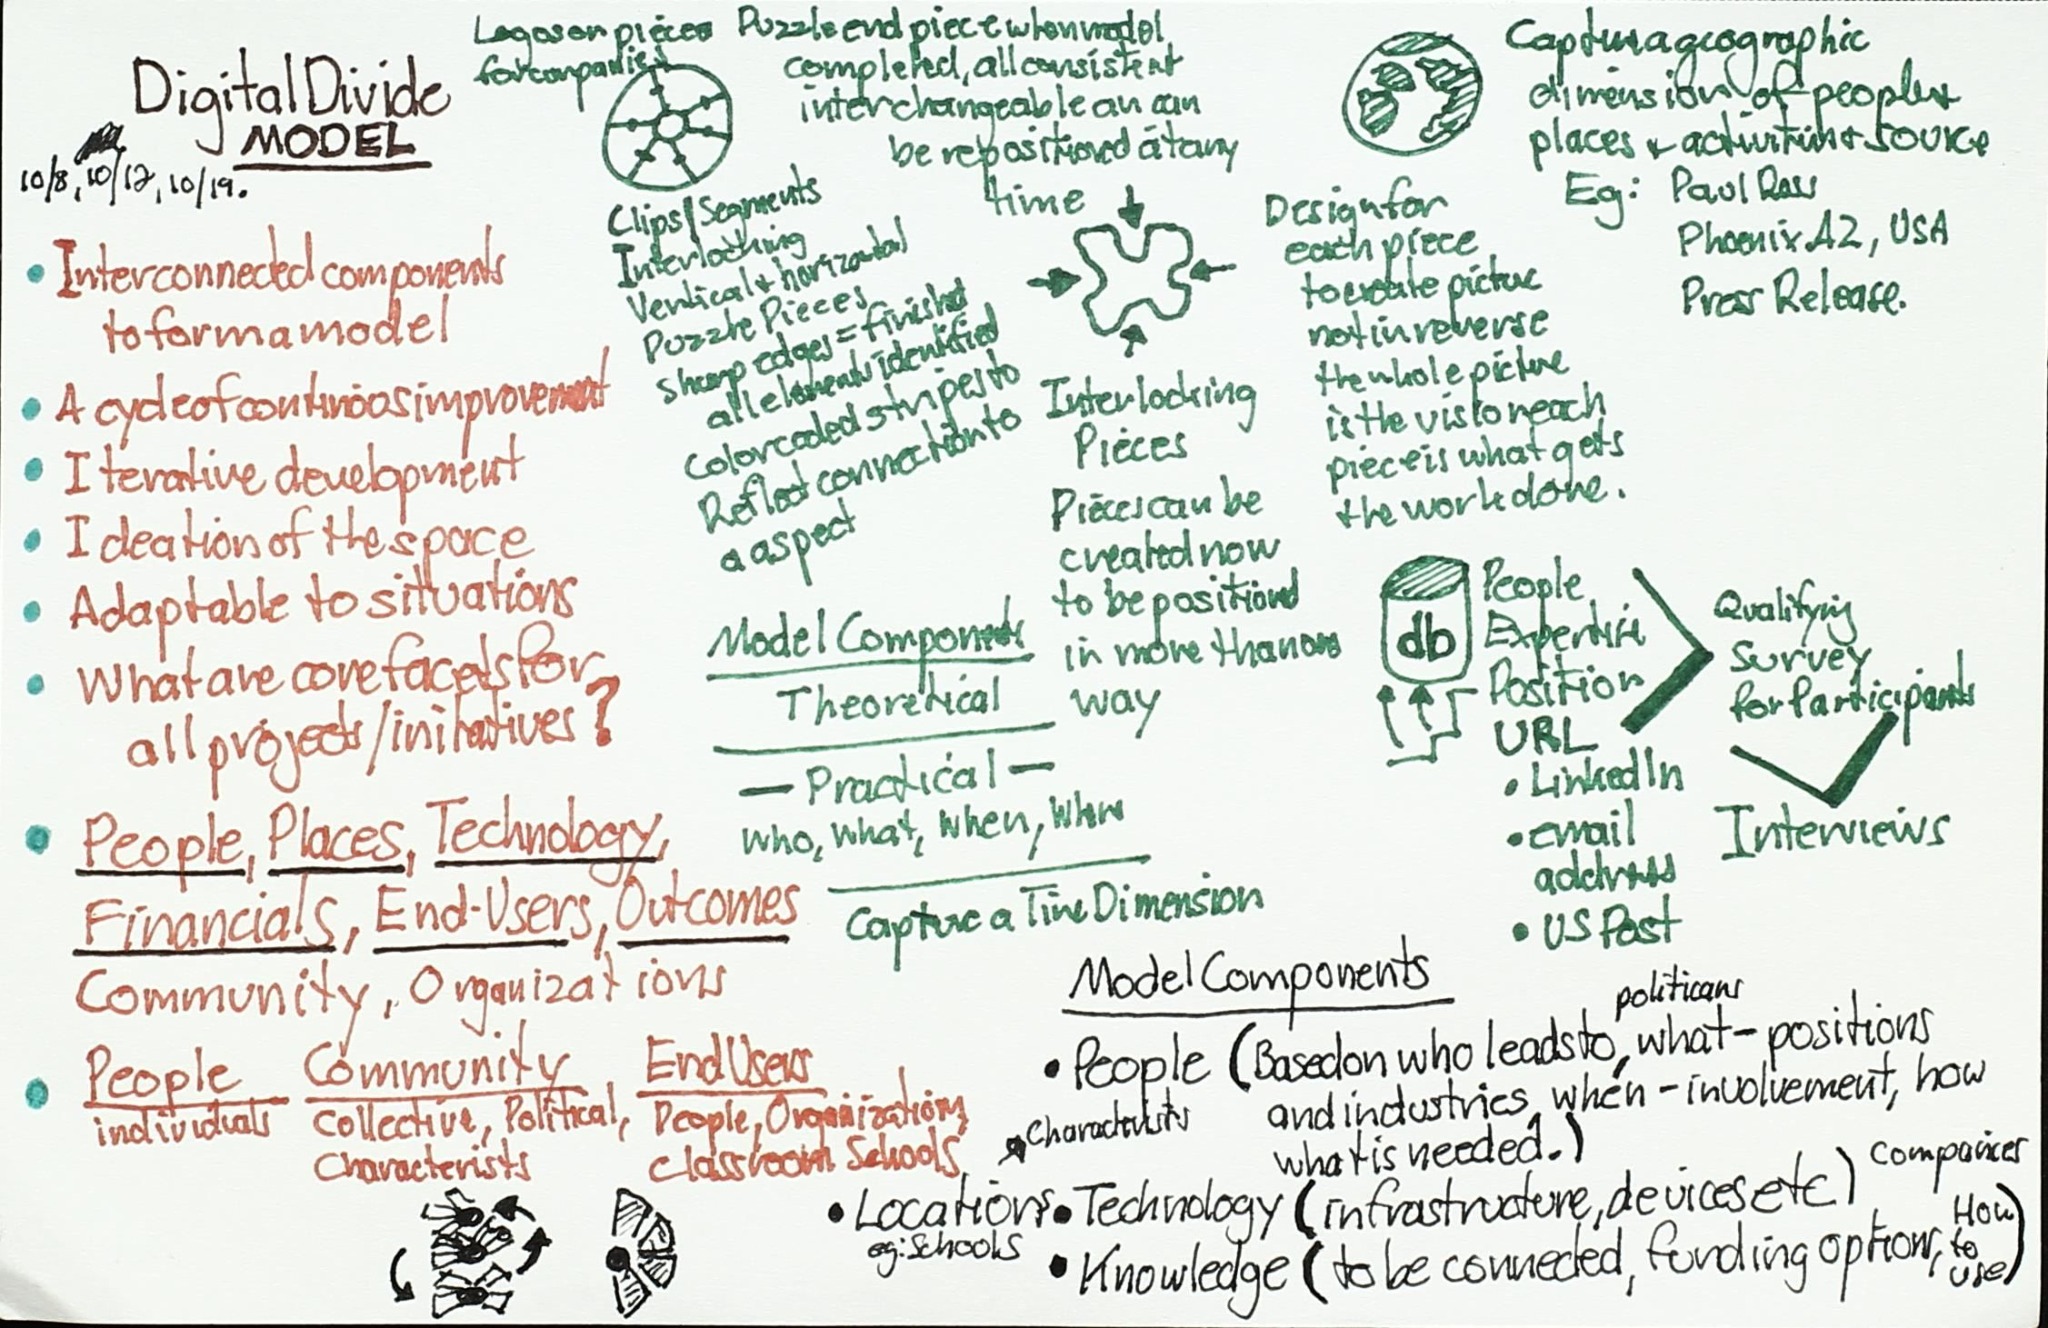
Digital-divide model notes connecting people, place, technology, finances, end users, and outcomes
Model development

People, place, and technology

Brings infrastructure and technology into relationship with community context, finances, end users, and intended outcomes.

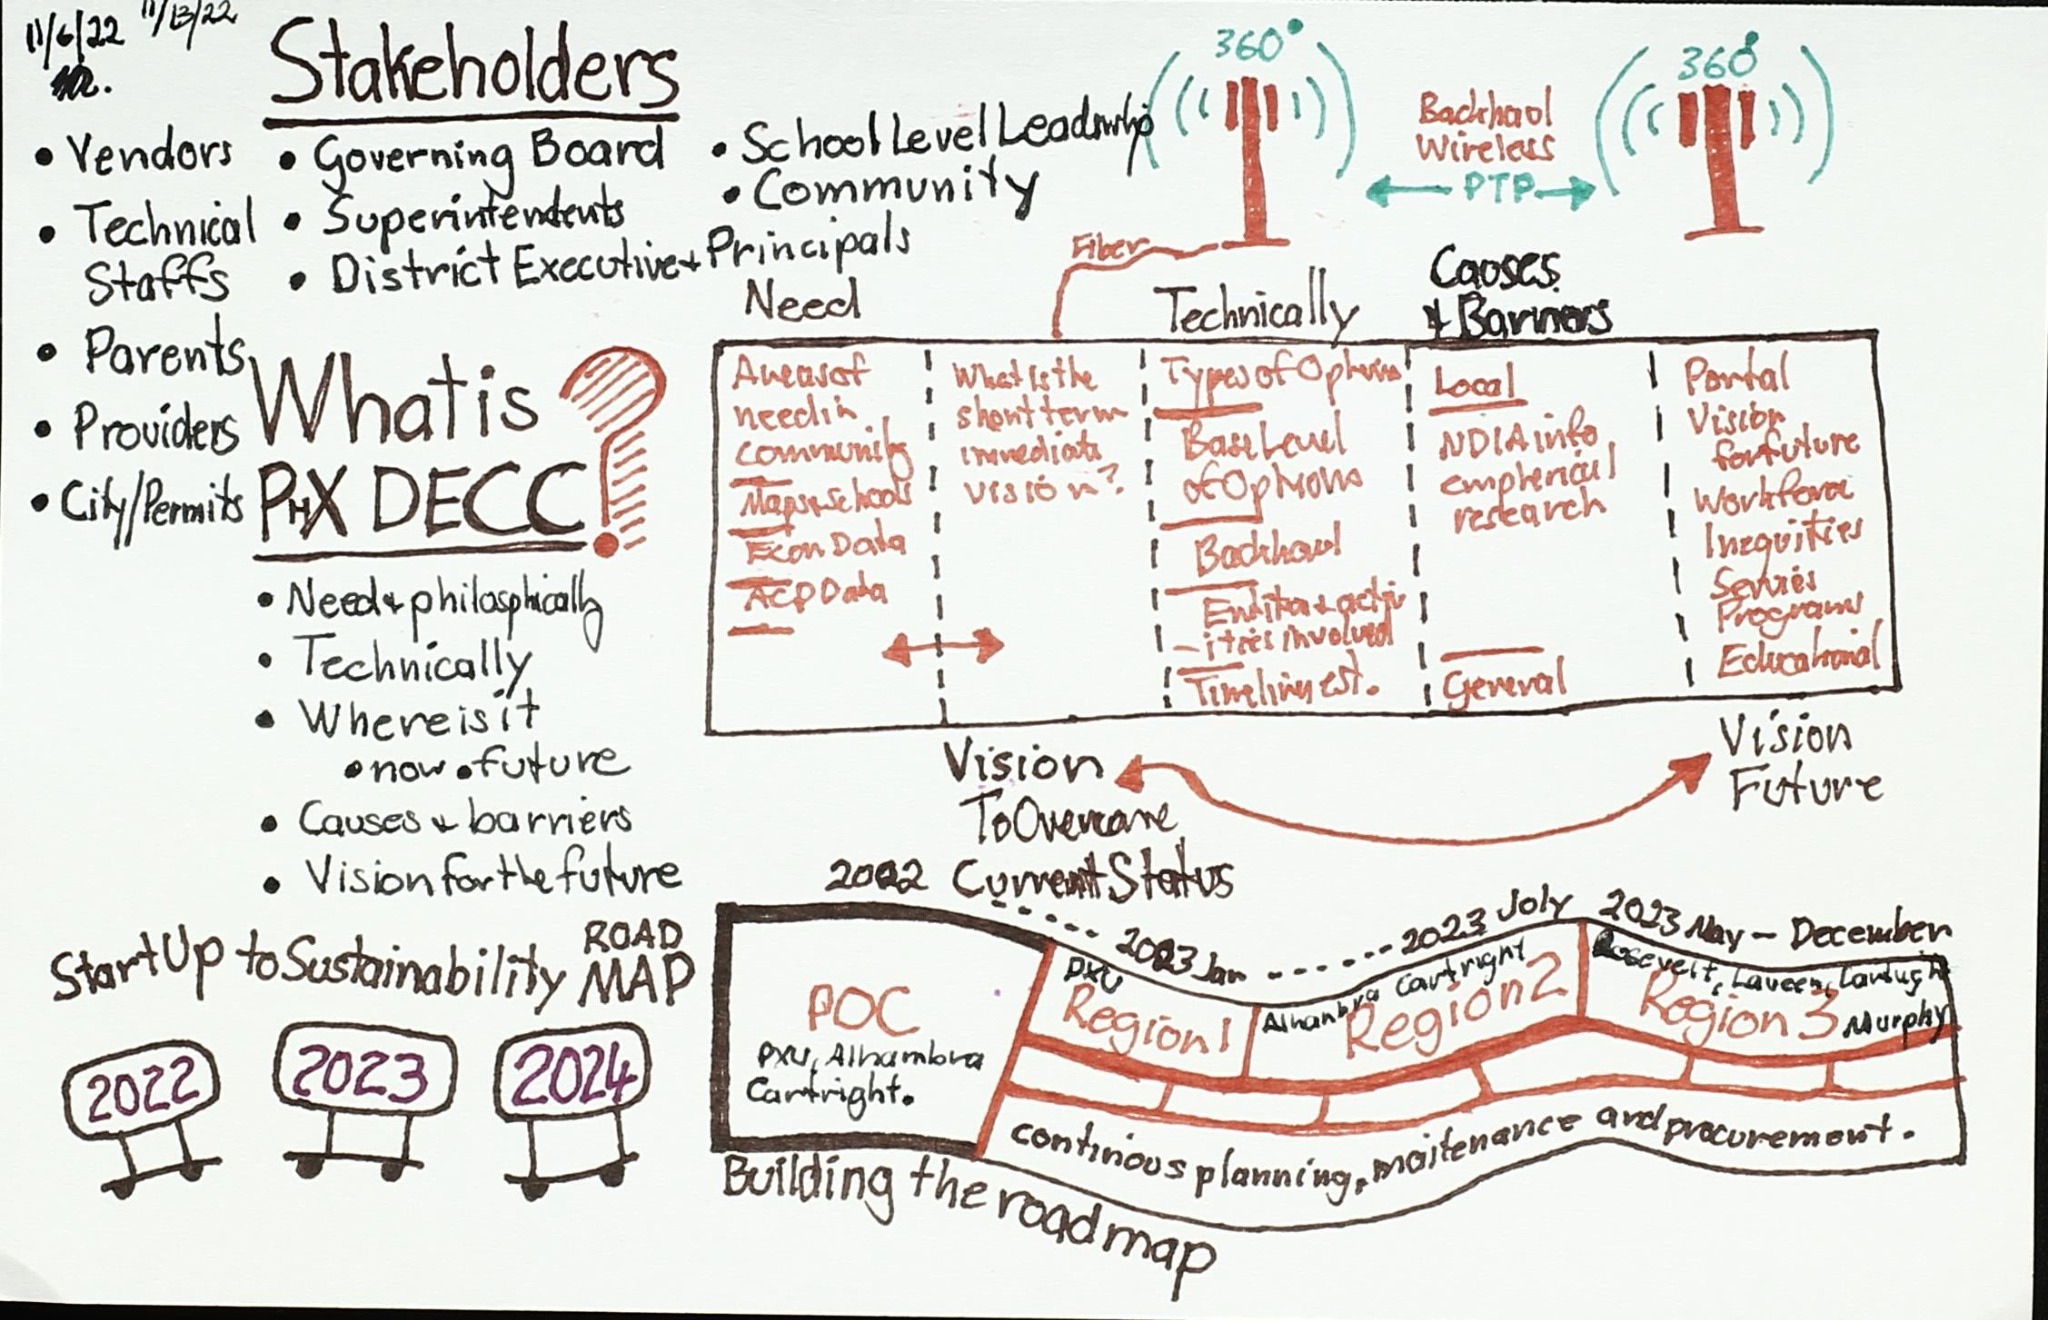
Stakeholder planning sketch for the Phoenix Digital Education Connection Canopy
Stakeholders

Building the stakeholder roadmap

Identifies partners, roles, technical and nontechnical cases, and a phased roadmap for regional collaboration.

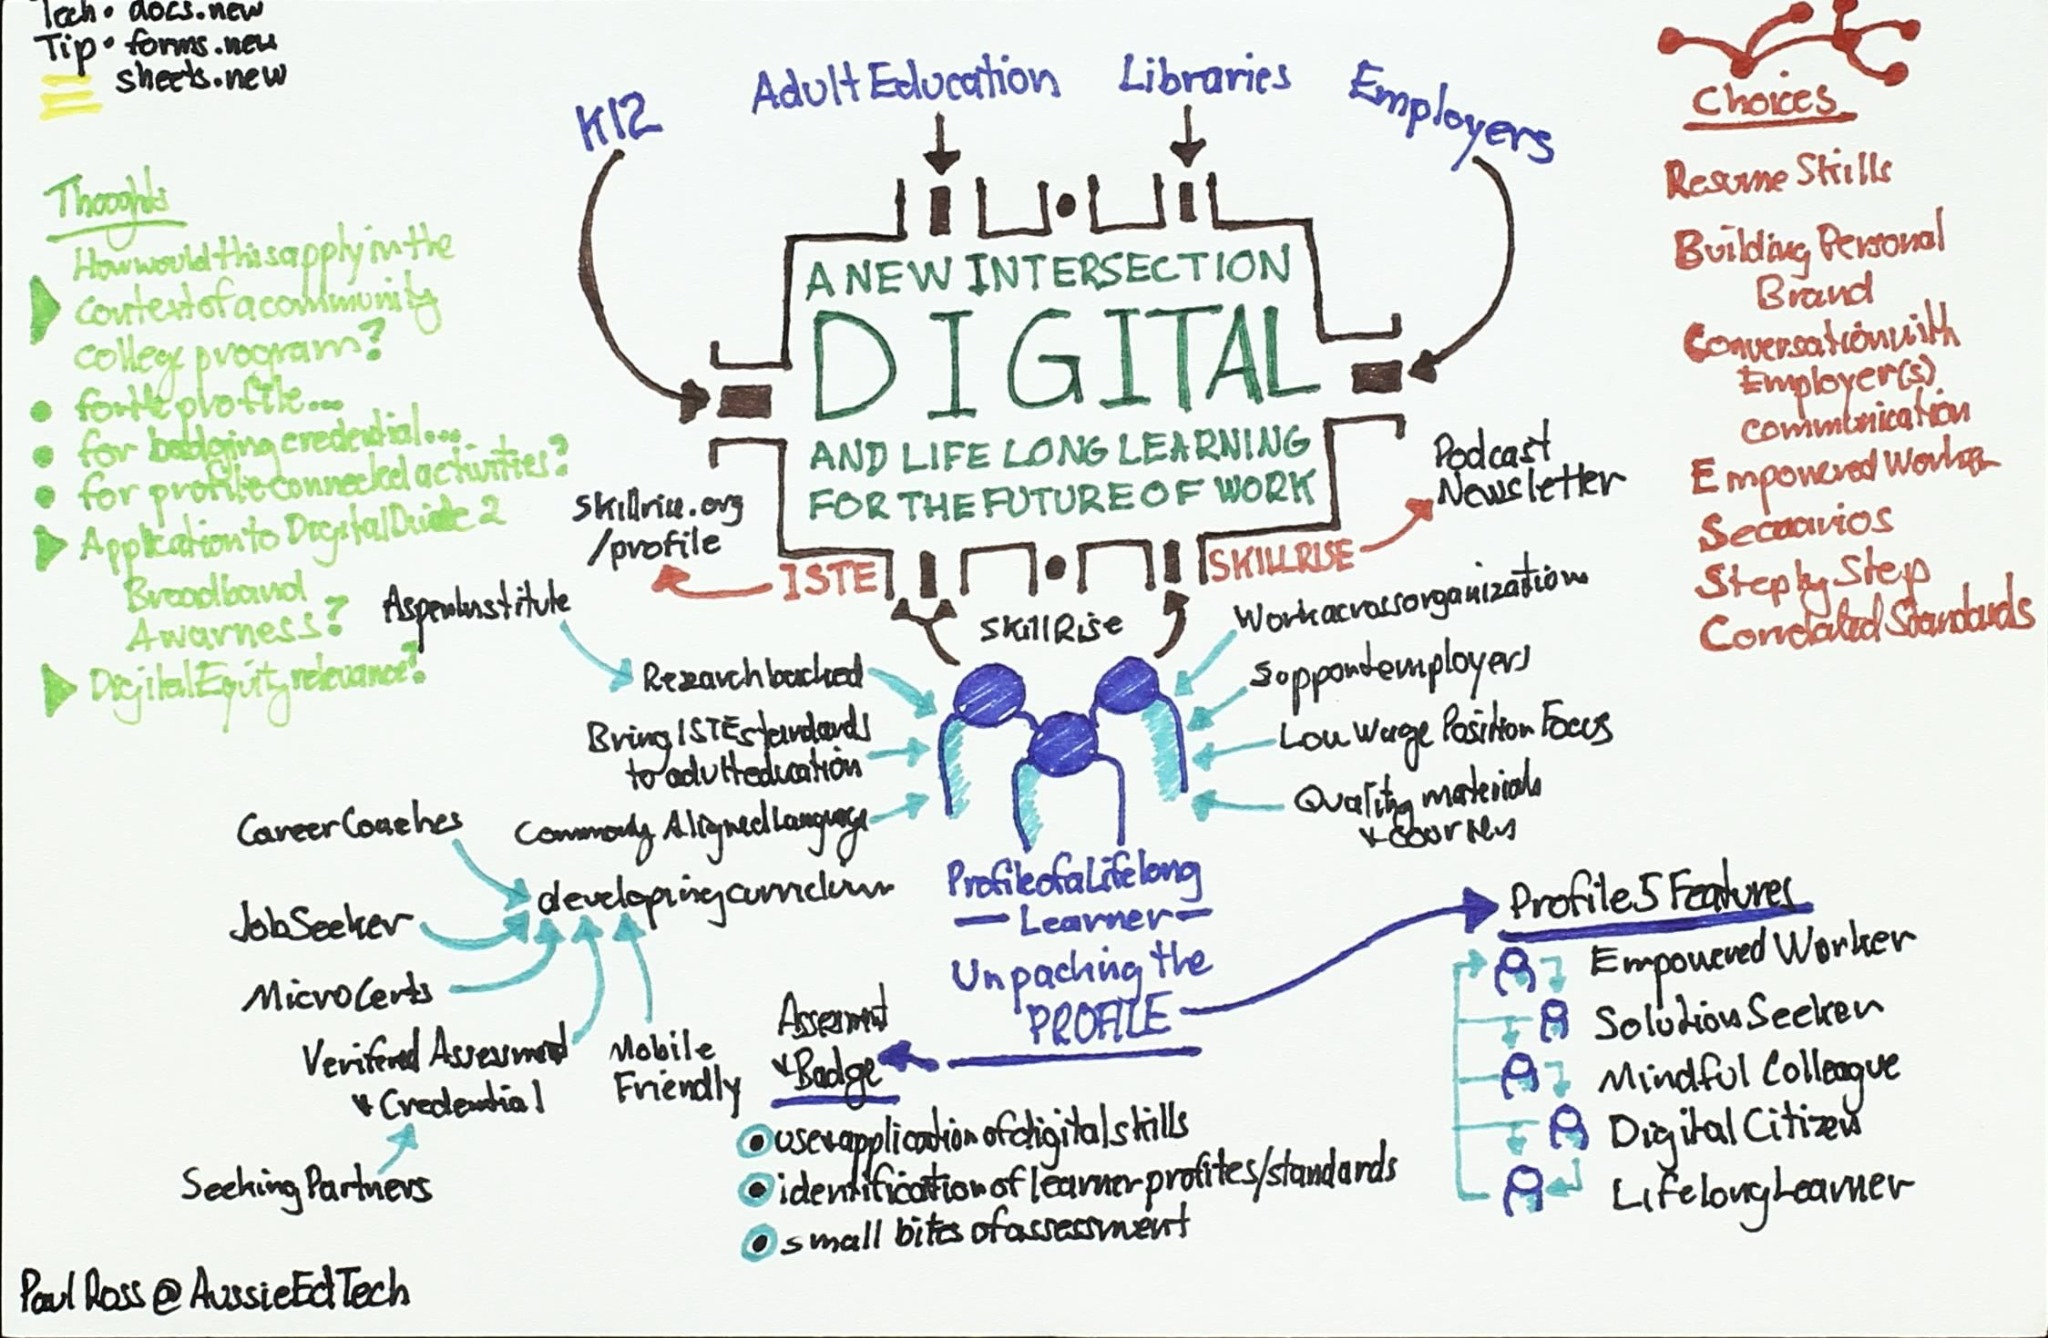
A new intersection digital and lifelong learning diagram connecting K-12, adult education, libraries, and employers
Learning pathways

Digital and lifelong learning

Connects education, libraries, employers, credentials, skills, and learner profiles across a lifelong pathway.

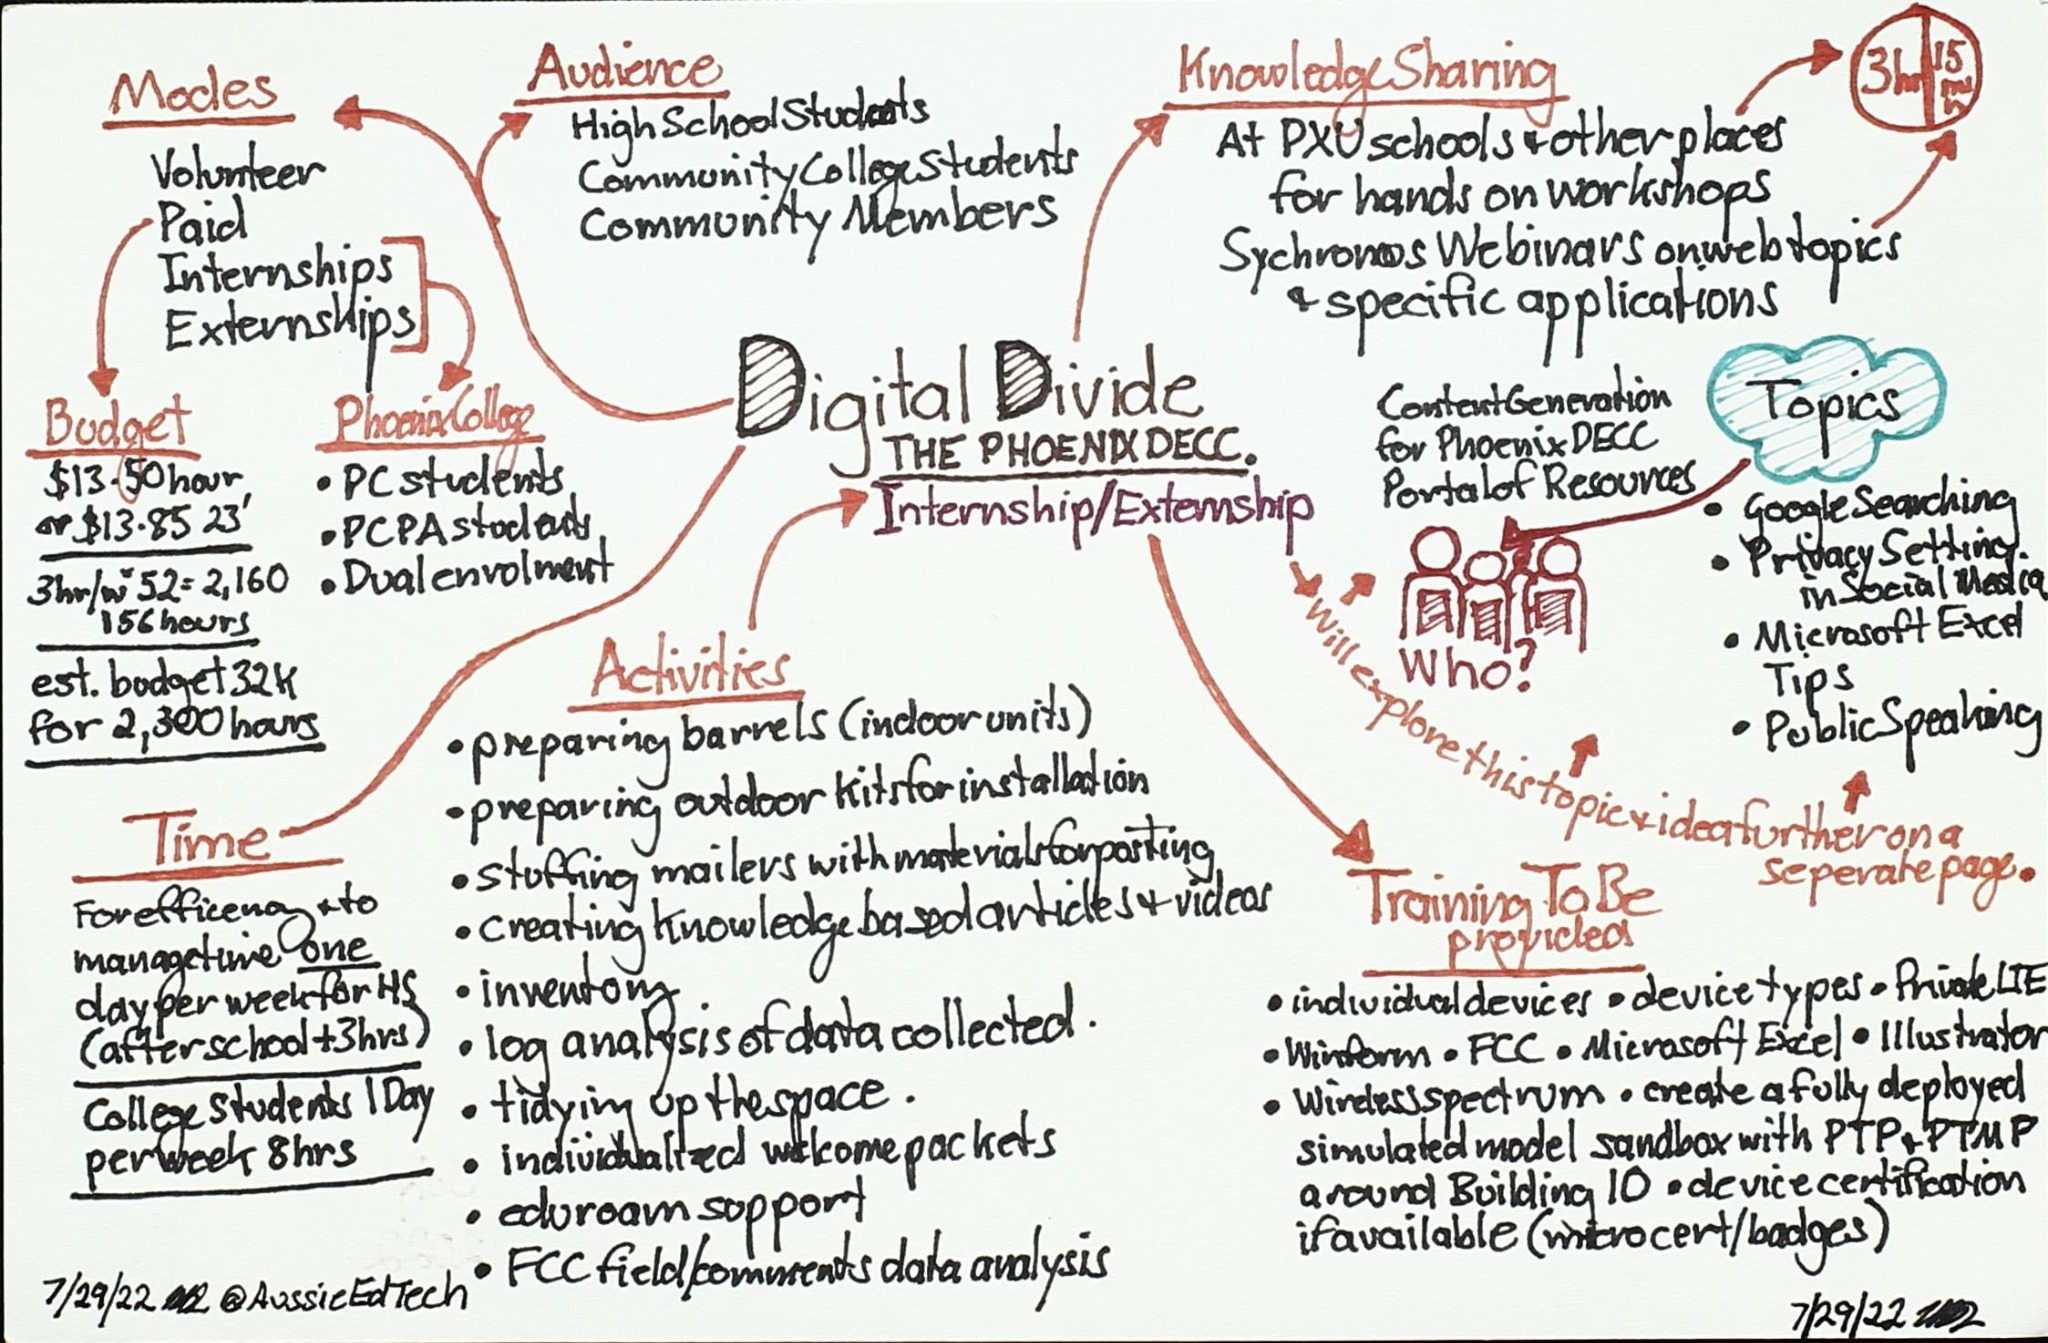
Phoenix DECC internship and externship planning mind map
Work-based learning

Internships and externships

Outlines audiences, activities, schedules, training, topics, and practical roles for applied learning experiences.

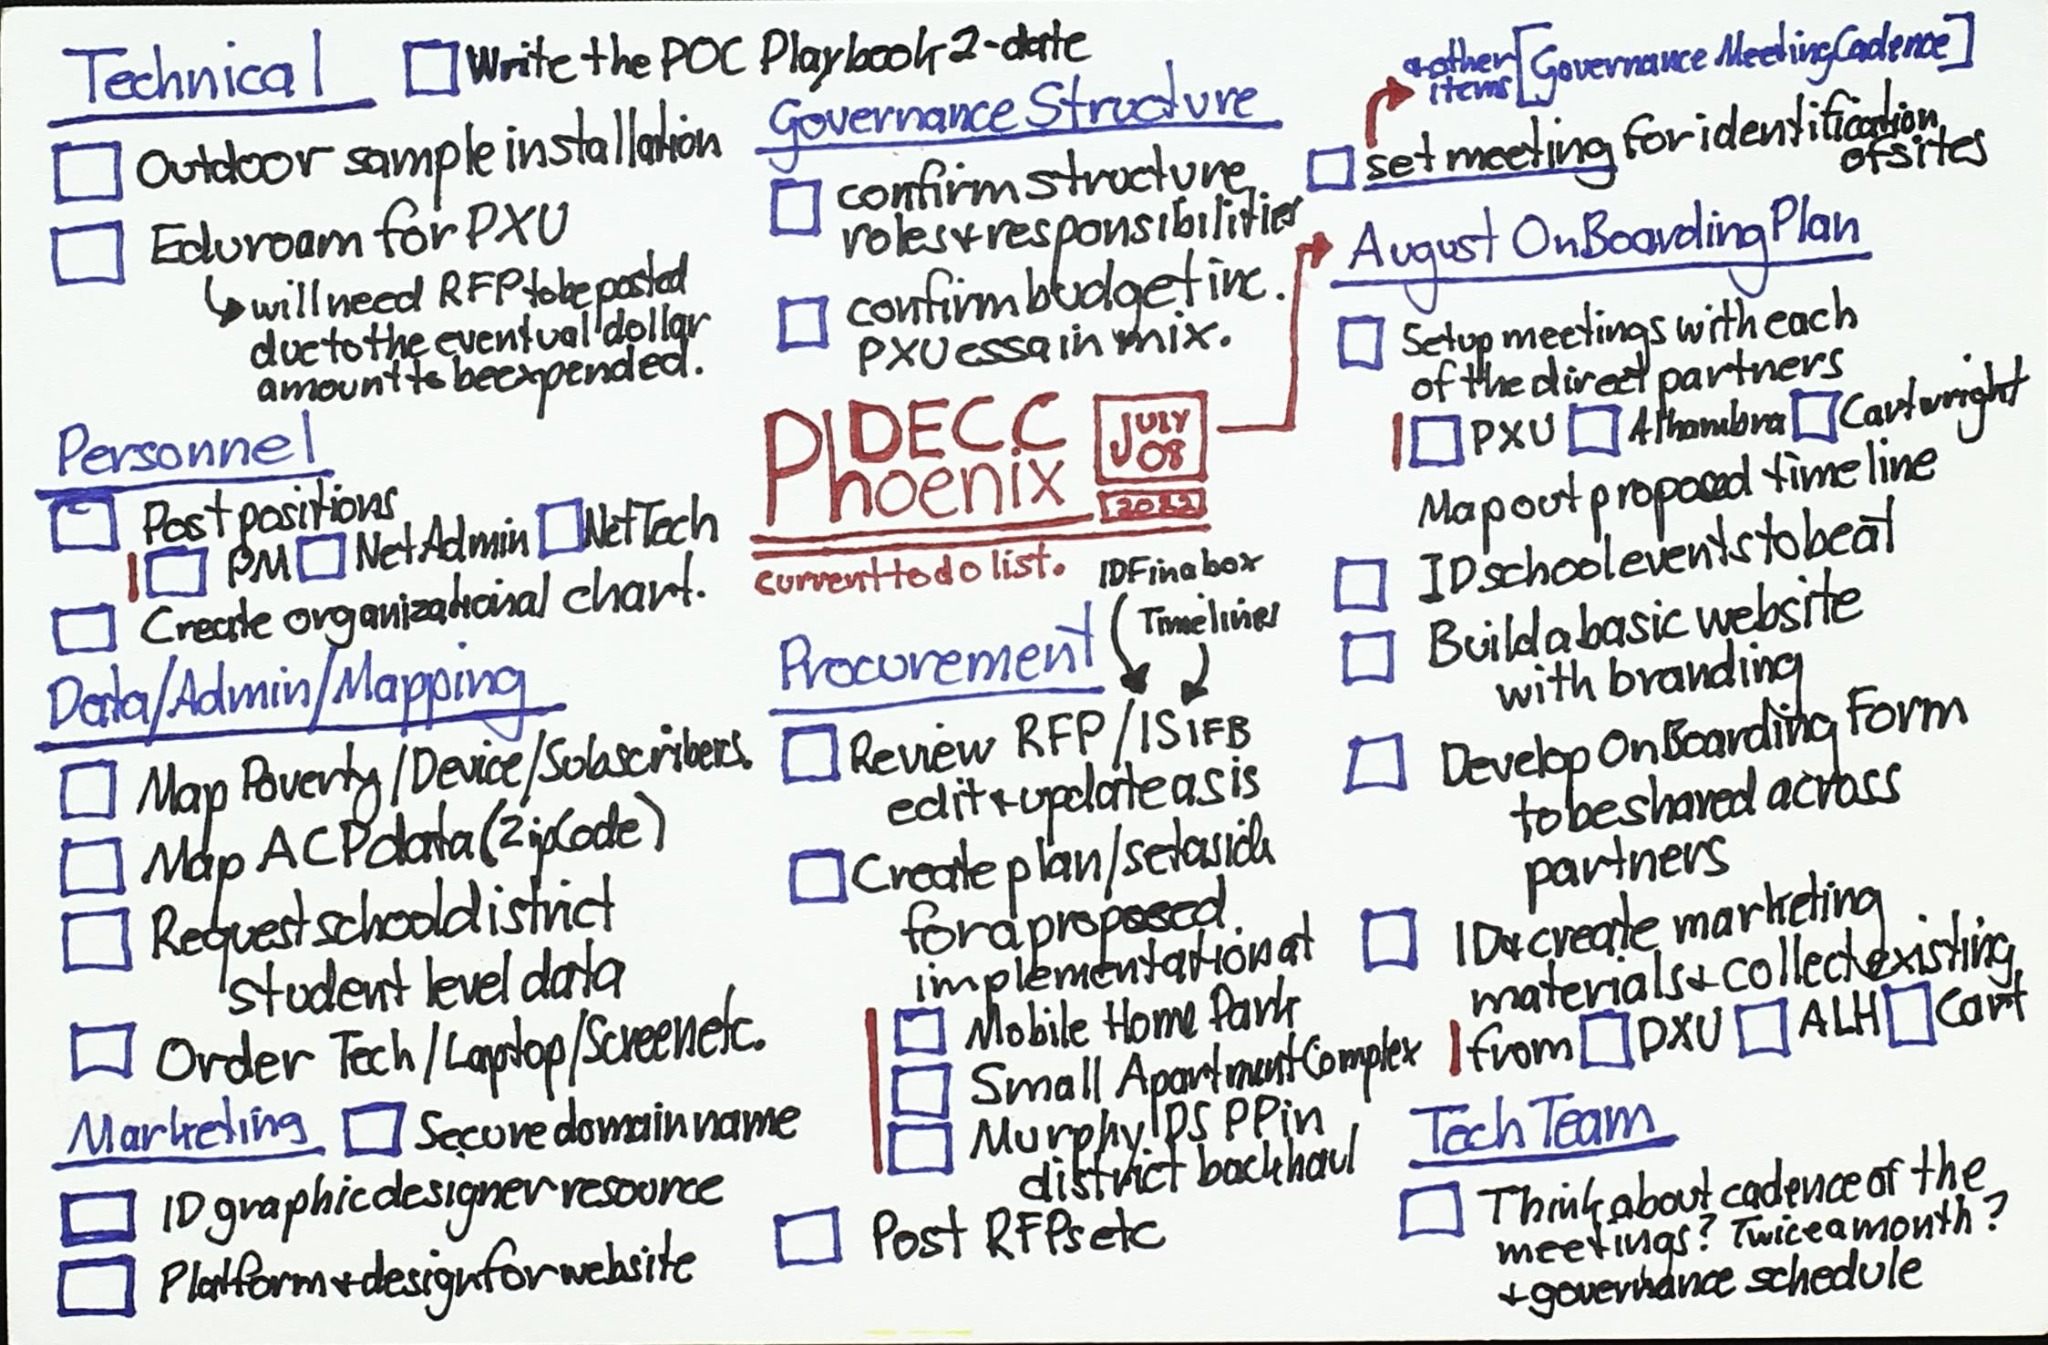
Phoenix DECC technical, governance, data, marketing, and implementation checklist
Project planning

Implementation checklist

Turns the initiative into coordinated technical, governance, procurement, mapping, marketing, and scheduling tasks.

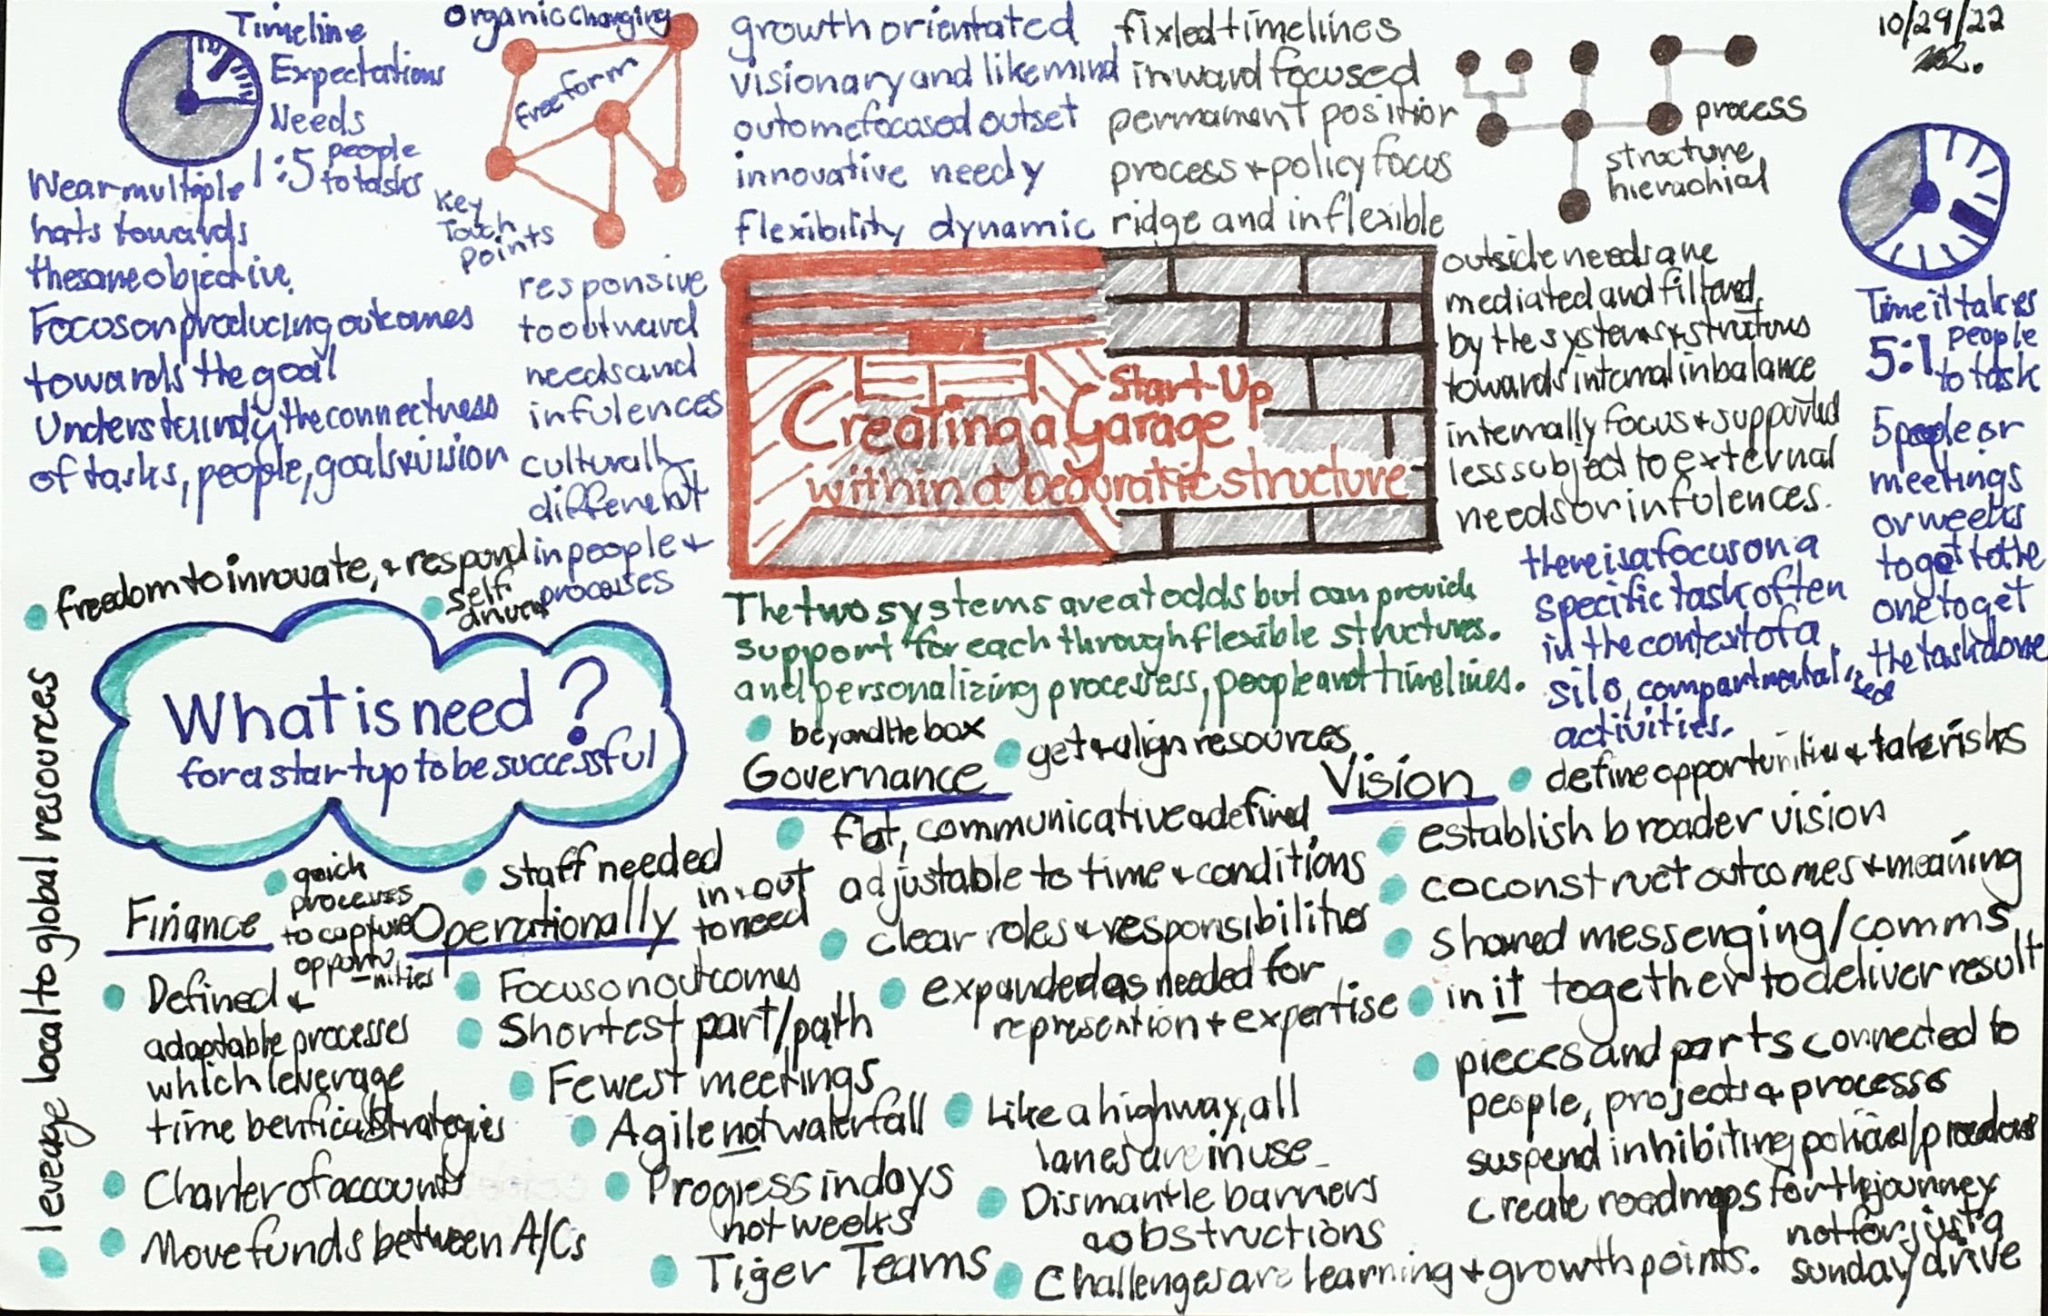
Creating a shared structure memo organized around the question what is needed
Shared structure

What is needed?

Frames common needs across people, funding, governance, technology, training, communication, and evaluation.

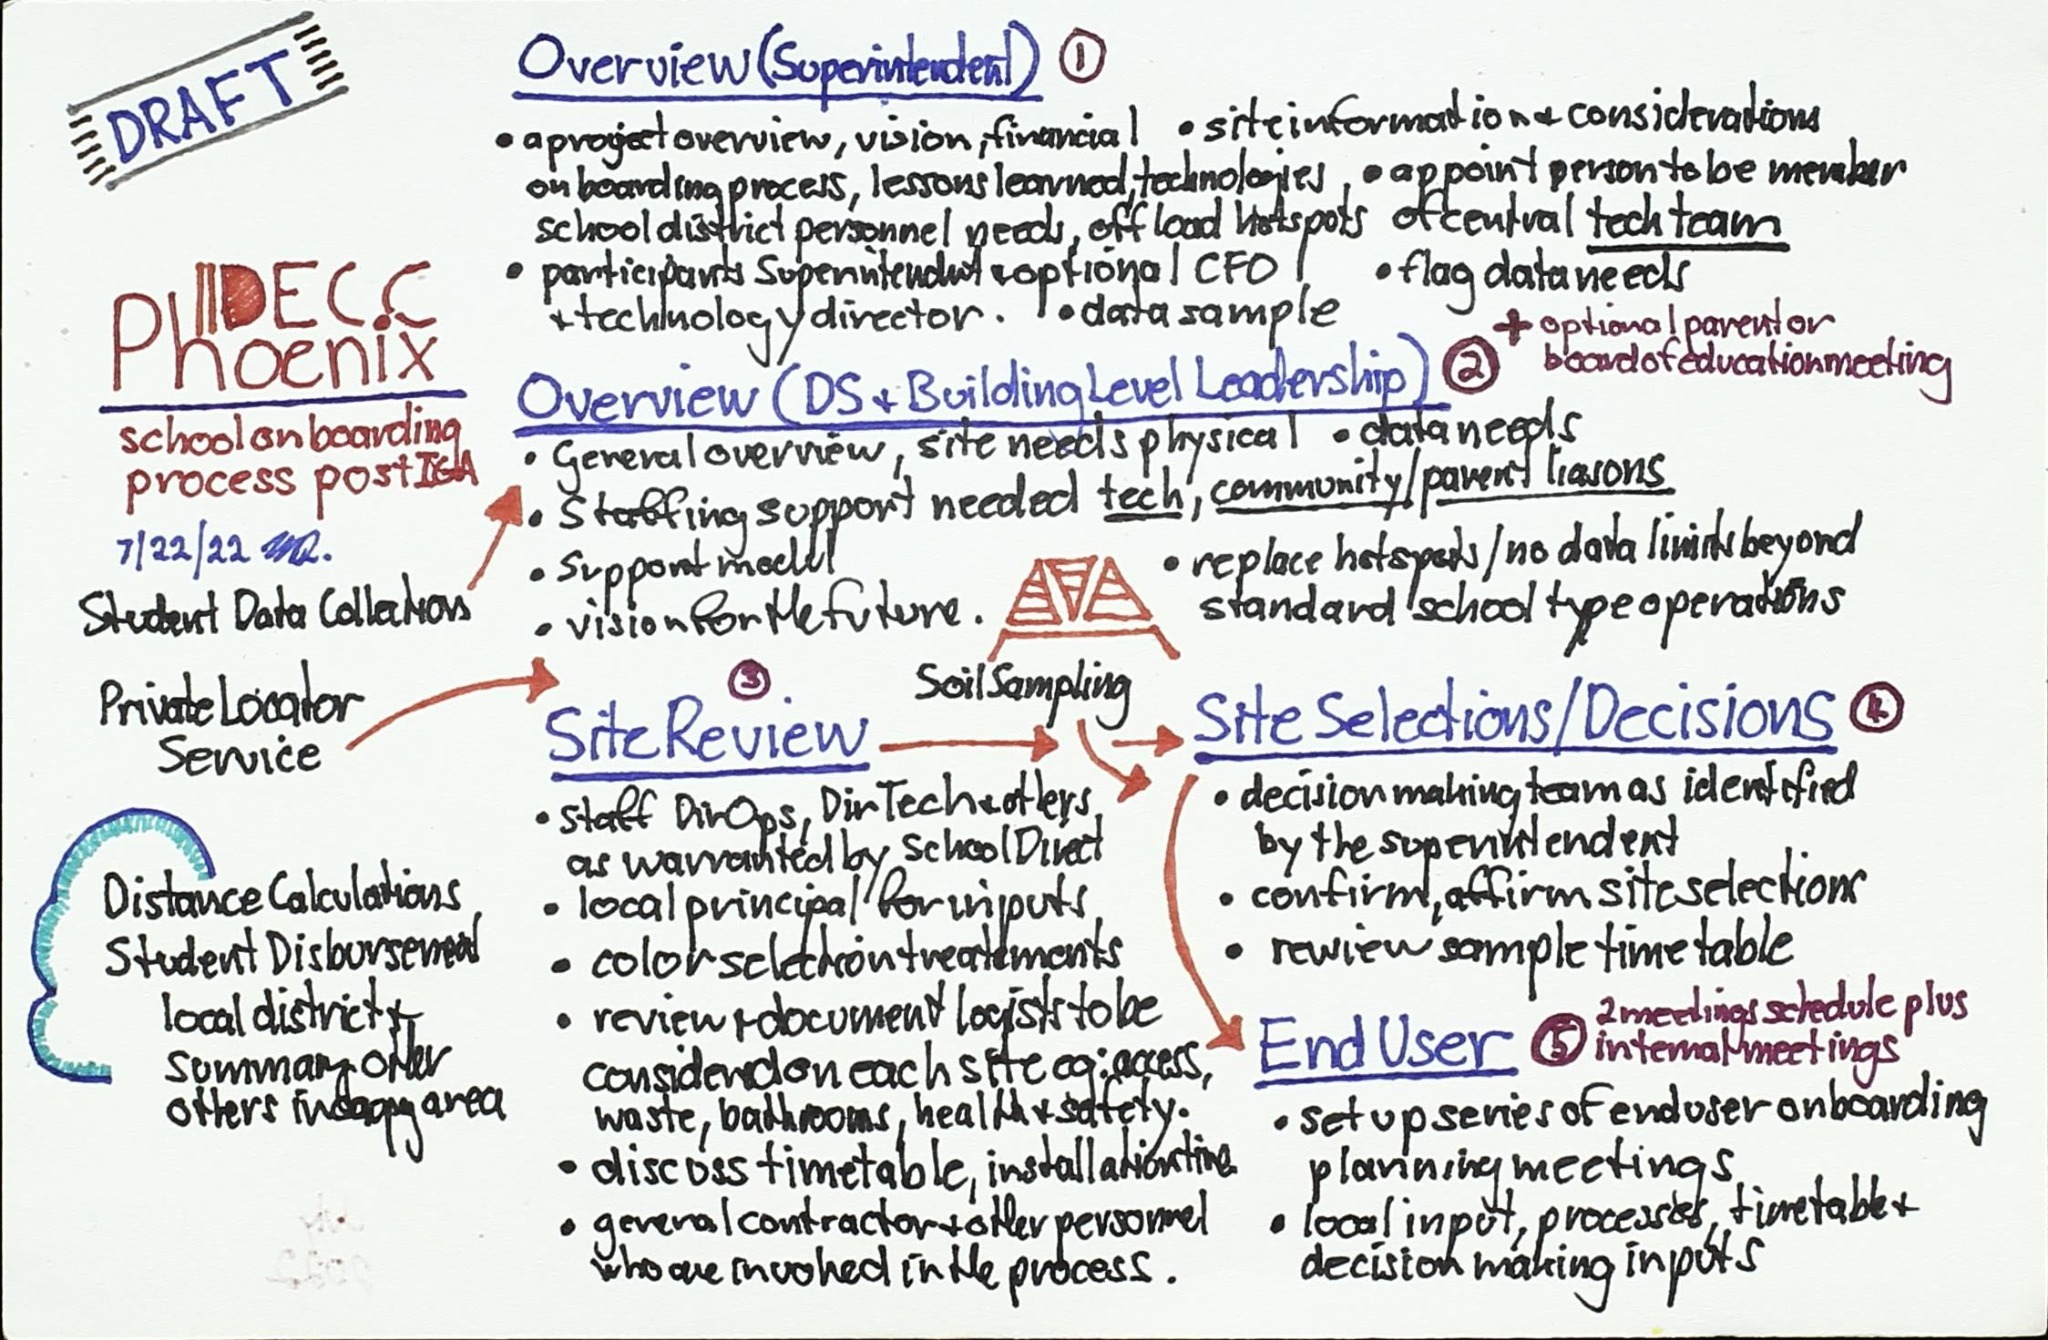
Draft Phoenix model workflow from overview and site review to decisions and end-user deployment
Delivery process

Phoenix implementation flow

Traces a practical sequence from project overview and site review through selection, decisions, and end-user service.

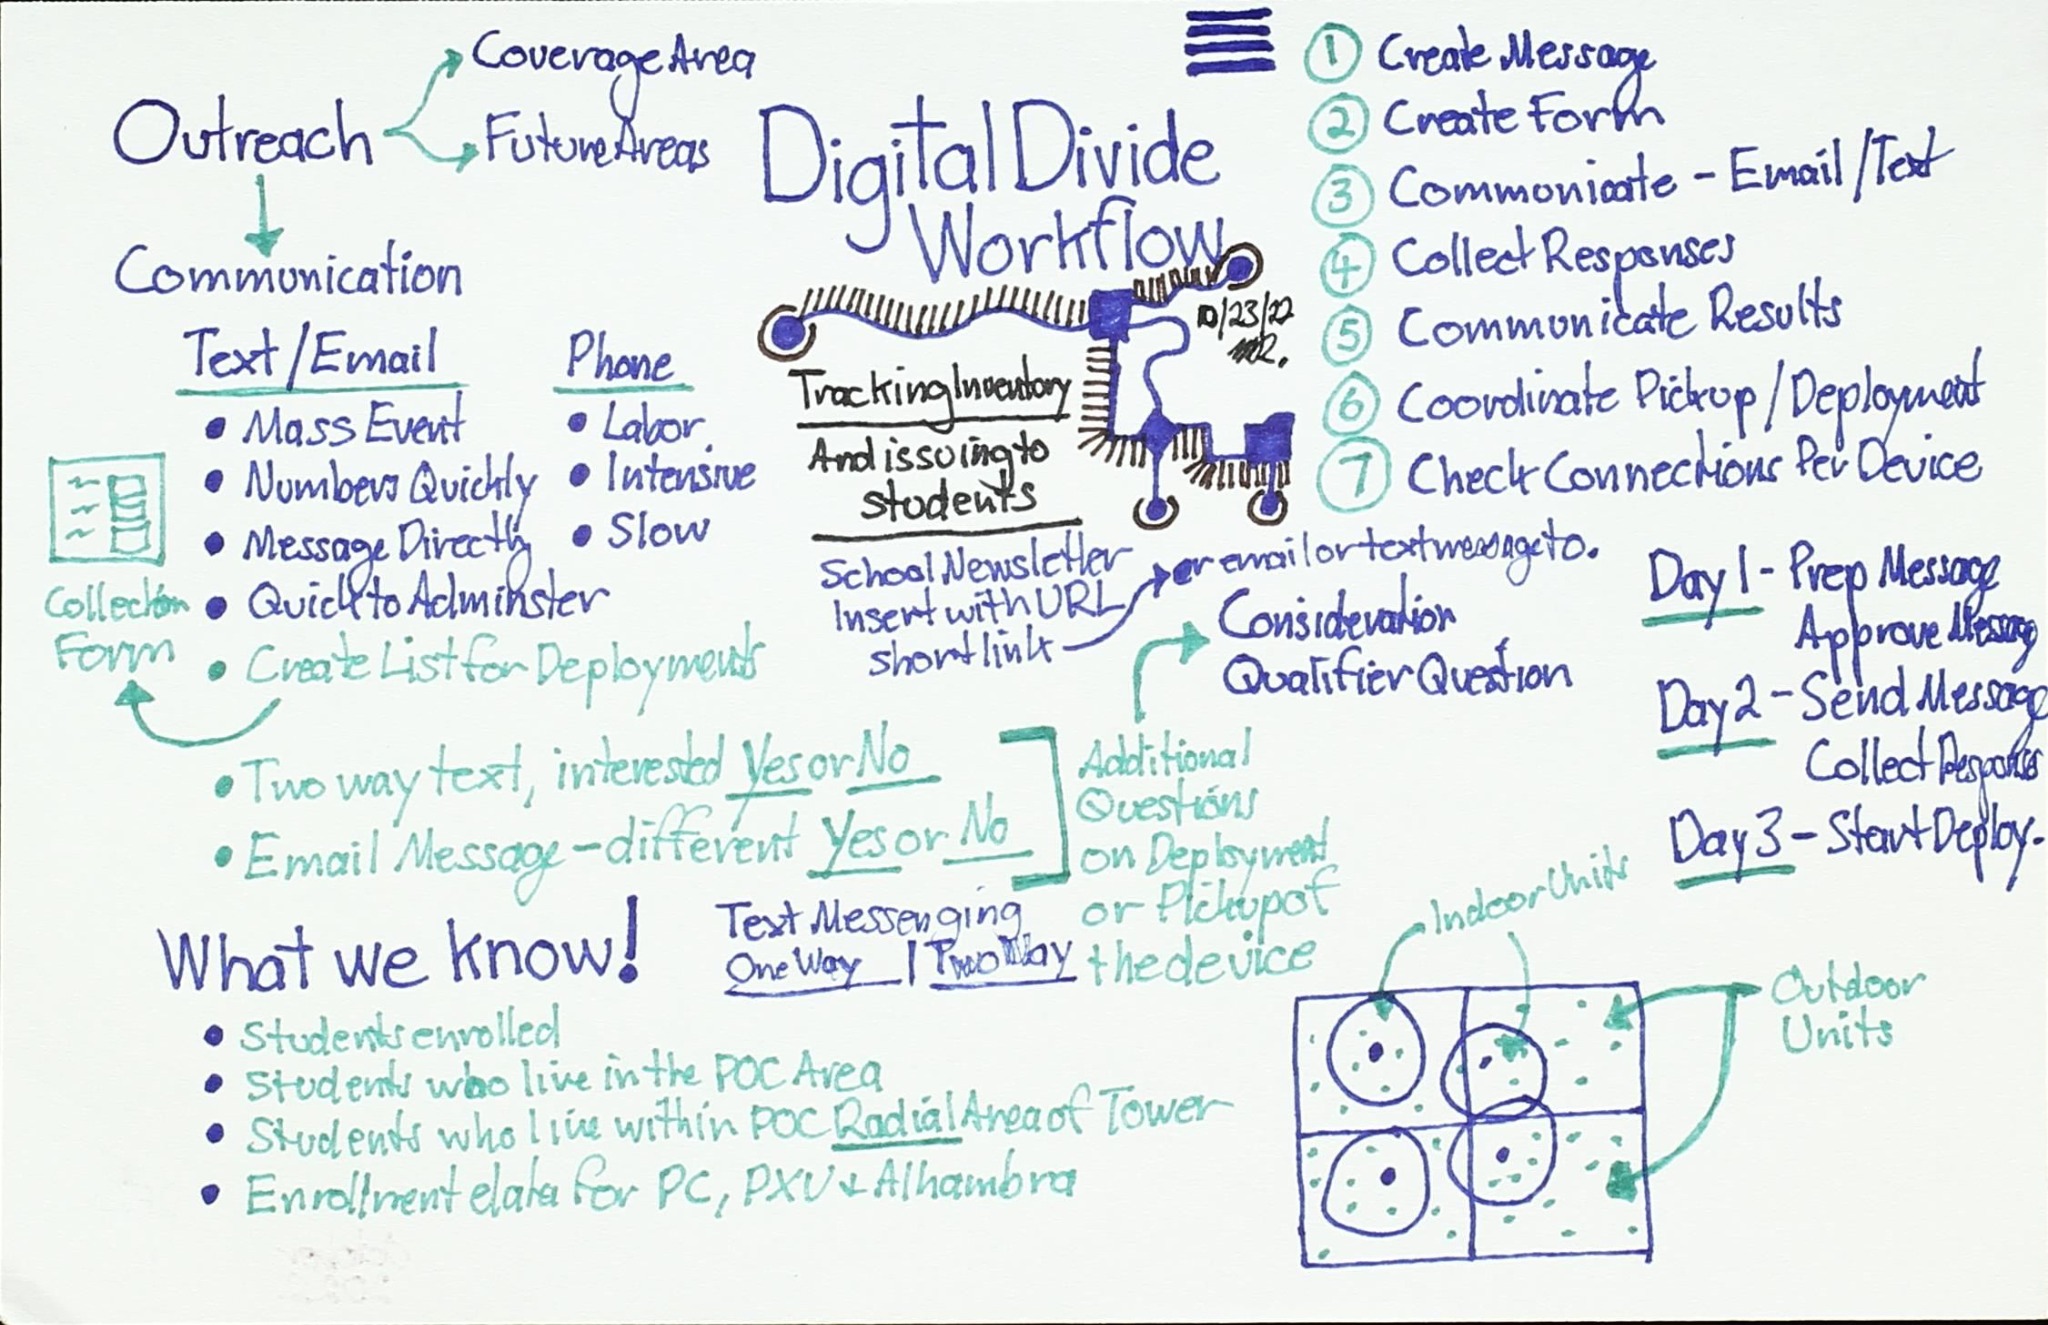
Digital-divide workforce outreach and communication planning memo
Outreach

Workforce communications

Organizes messages, audiences, channels, known information, unanswered questions, and a staged outreach cadence.

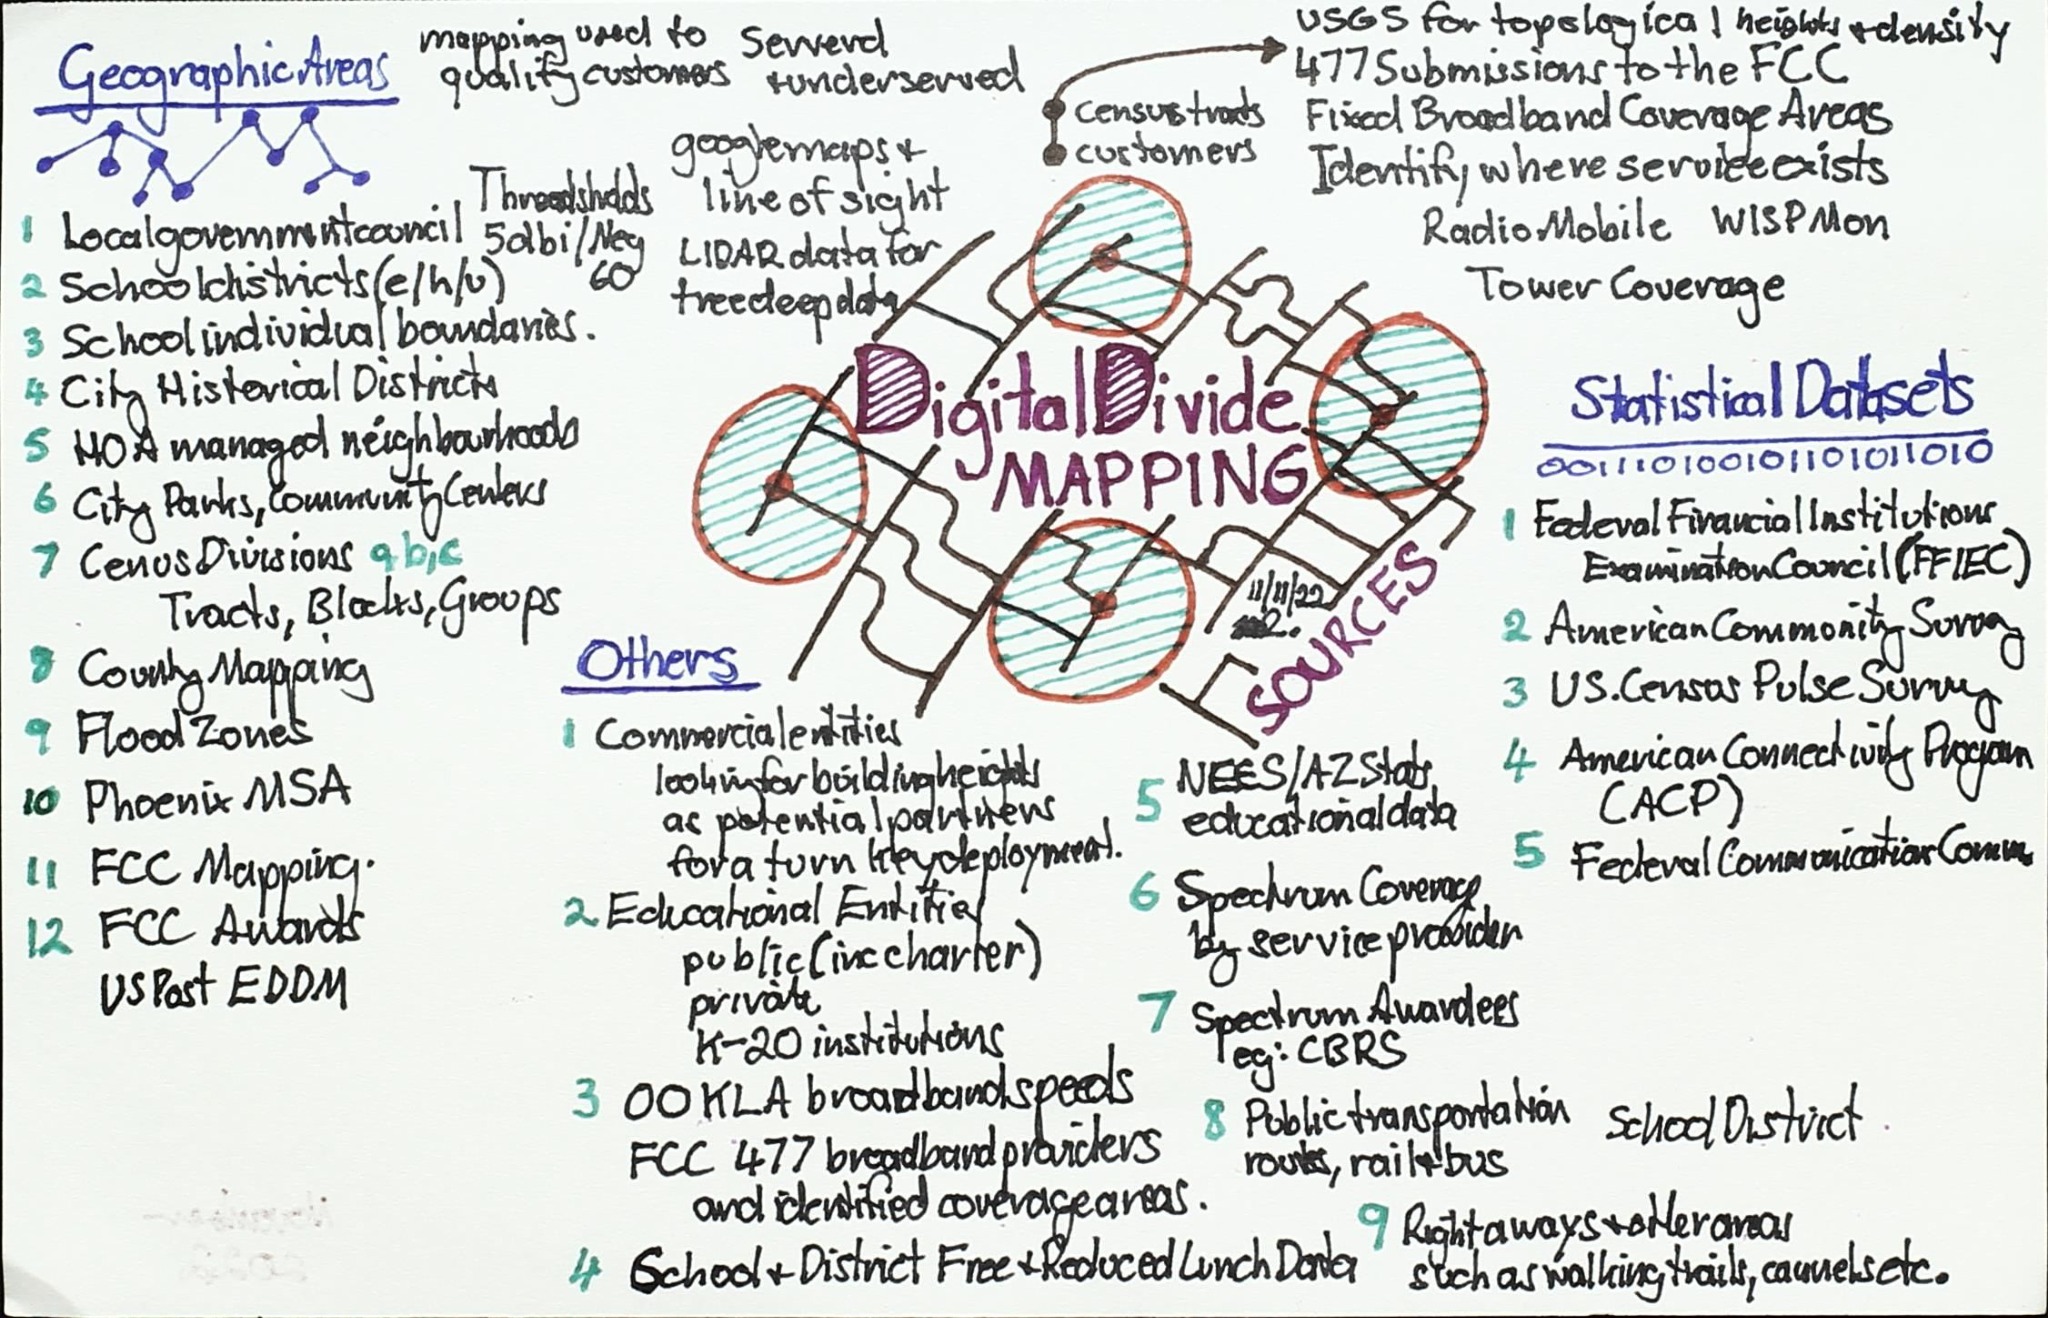
Digital-divide mapping sketch with geographic, statistical, school, broadband, and demographic layers
Data layers

Mapping the divide

Combines geographic, demographic, education, broadband, infrastructure, and statistical sources for place-based analysis.

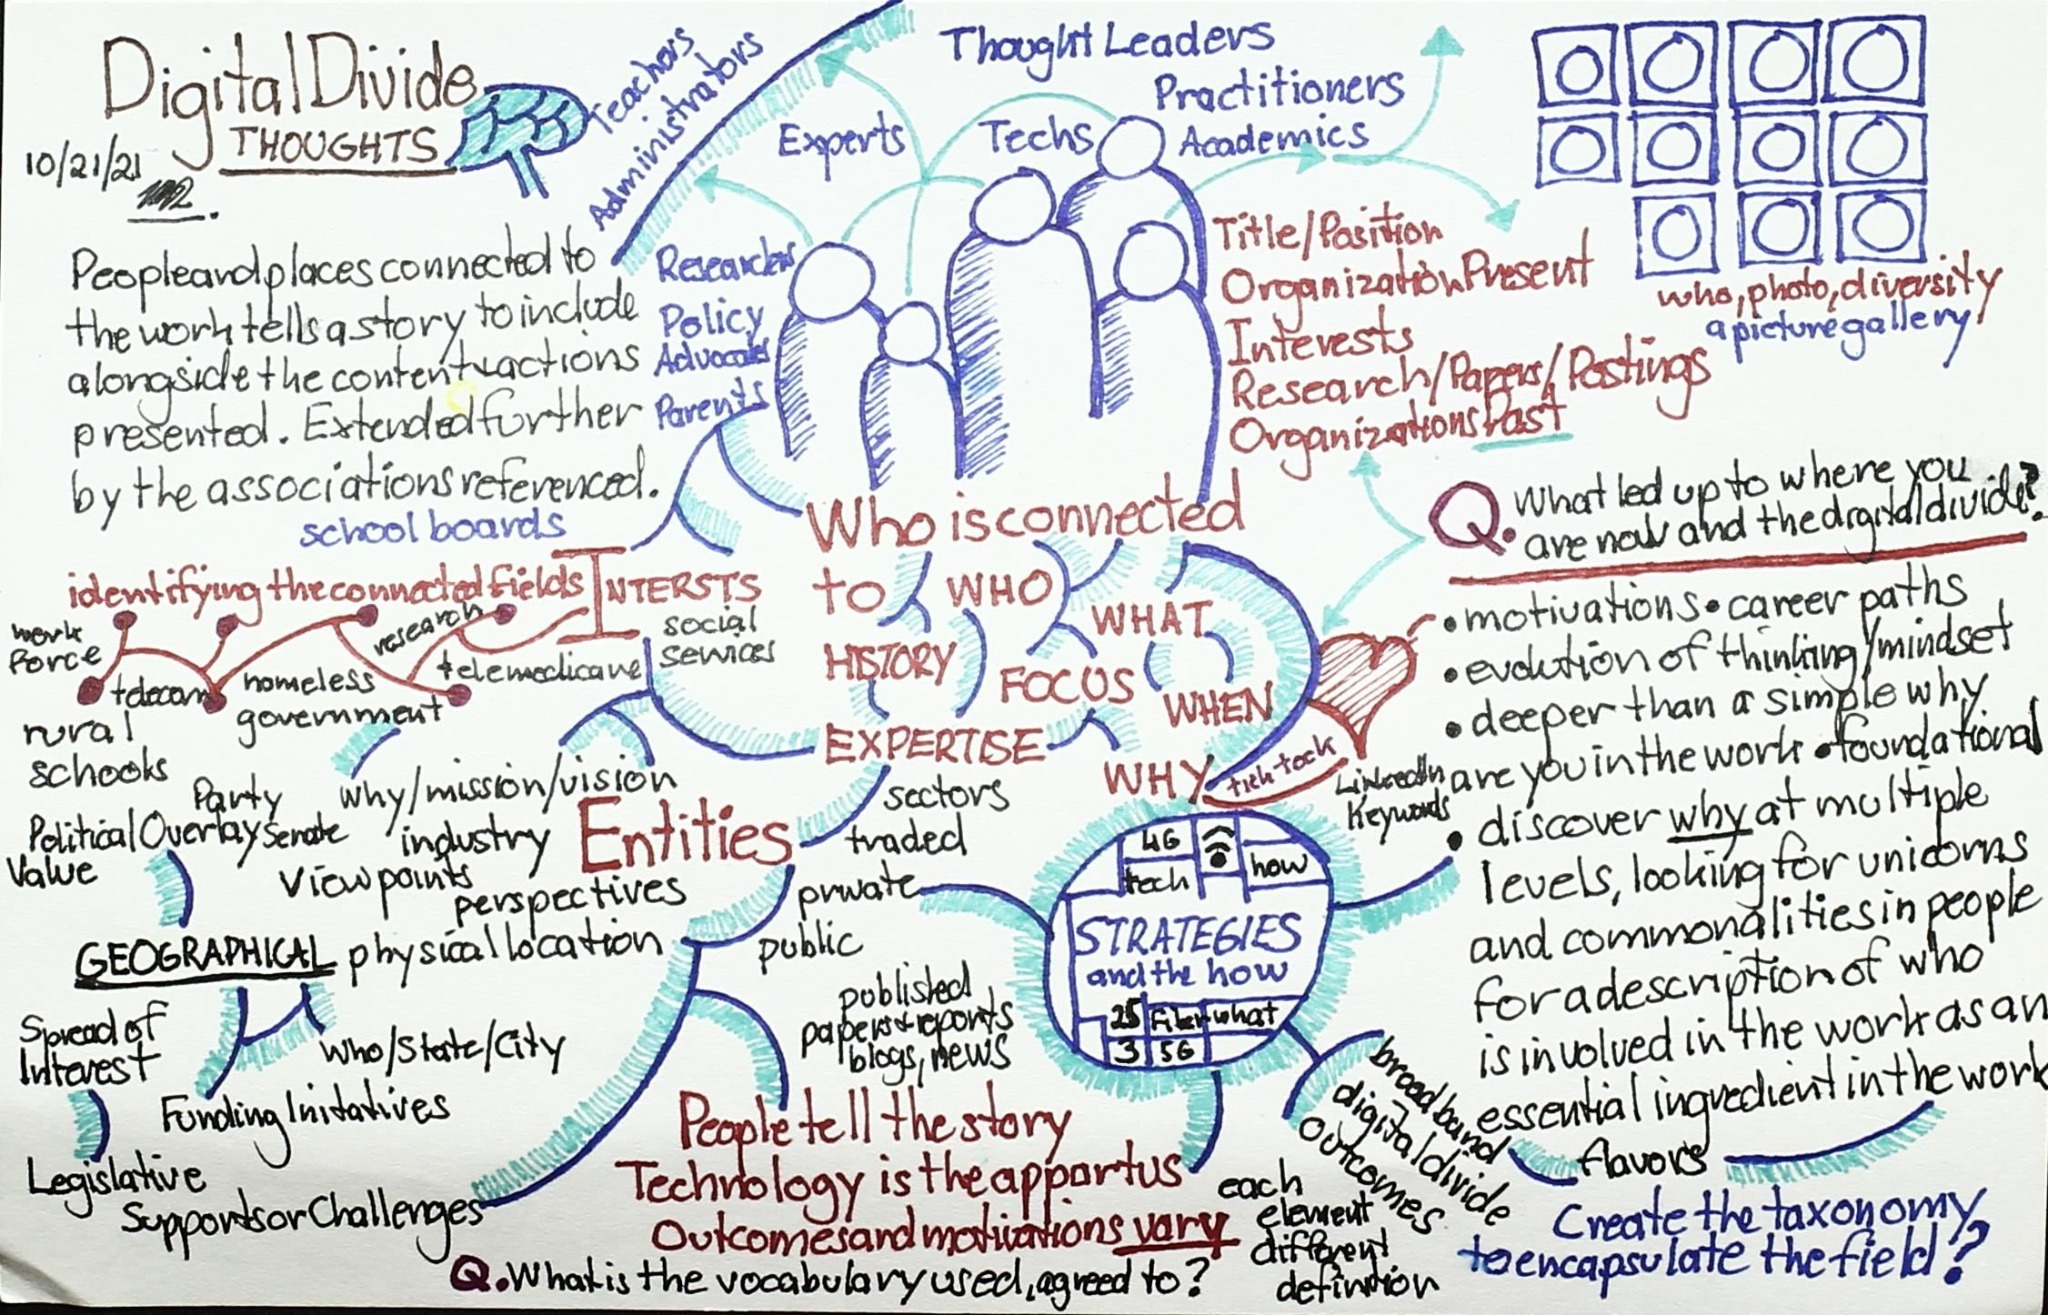
Second iteration of a digital-divide stakeholder and practitioner network map
Network iteration

Thought leaders and practitioners

Refines the network view by distinguishing roles, research interests, disciplinary perspectives, and strategic connections.

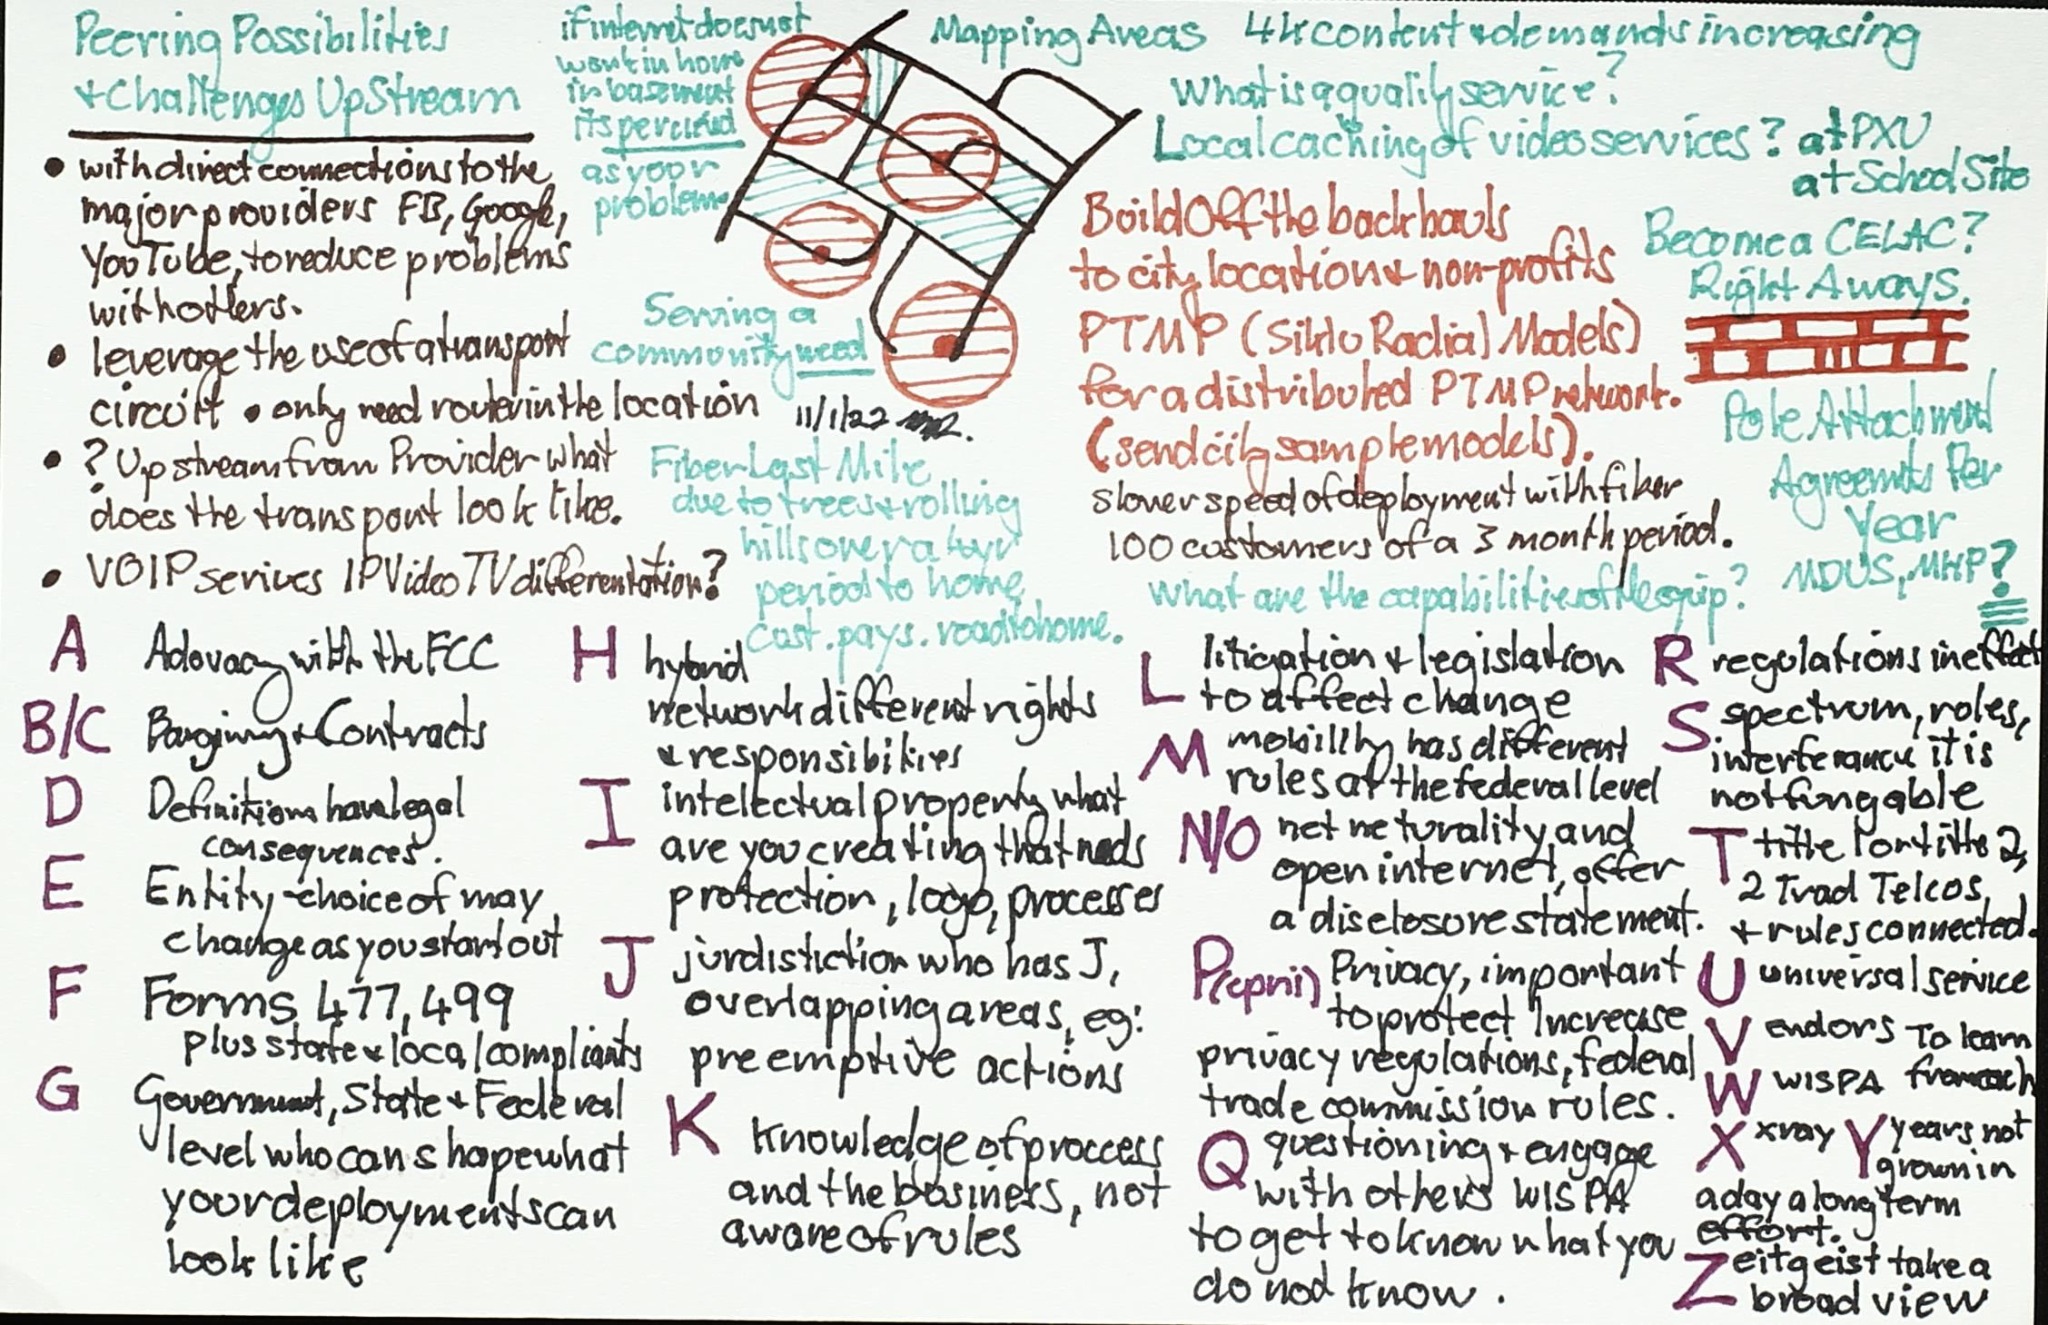
Digital-divide service model sketch organized by lettered components and mapping areas
Service architecture

Components of a service model

Catalogs facilities, connectivity, mapping, standards, programs, roles, and partnerships as linked service components.

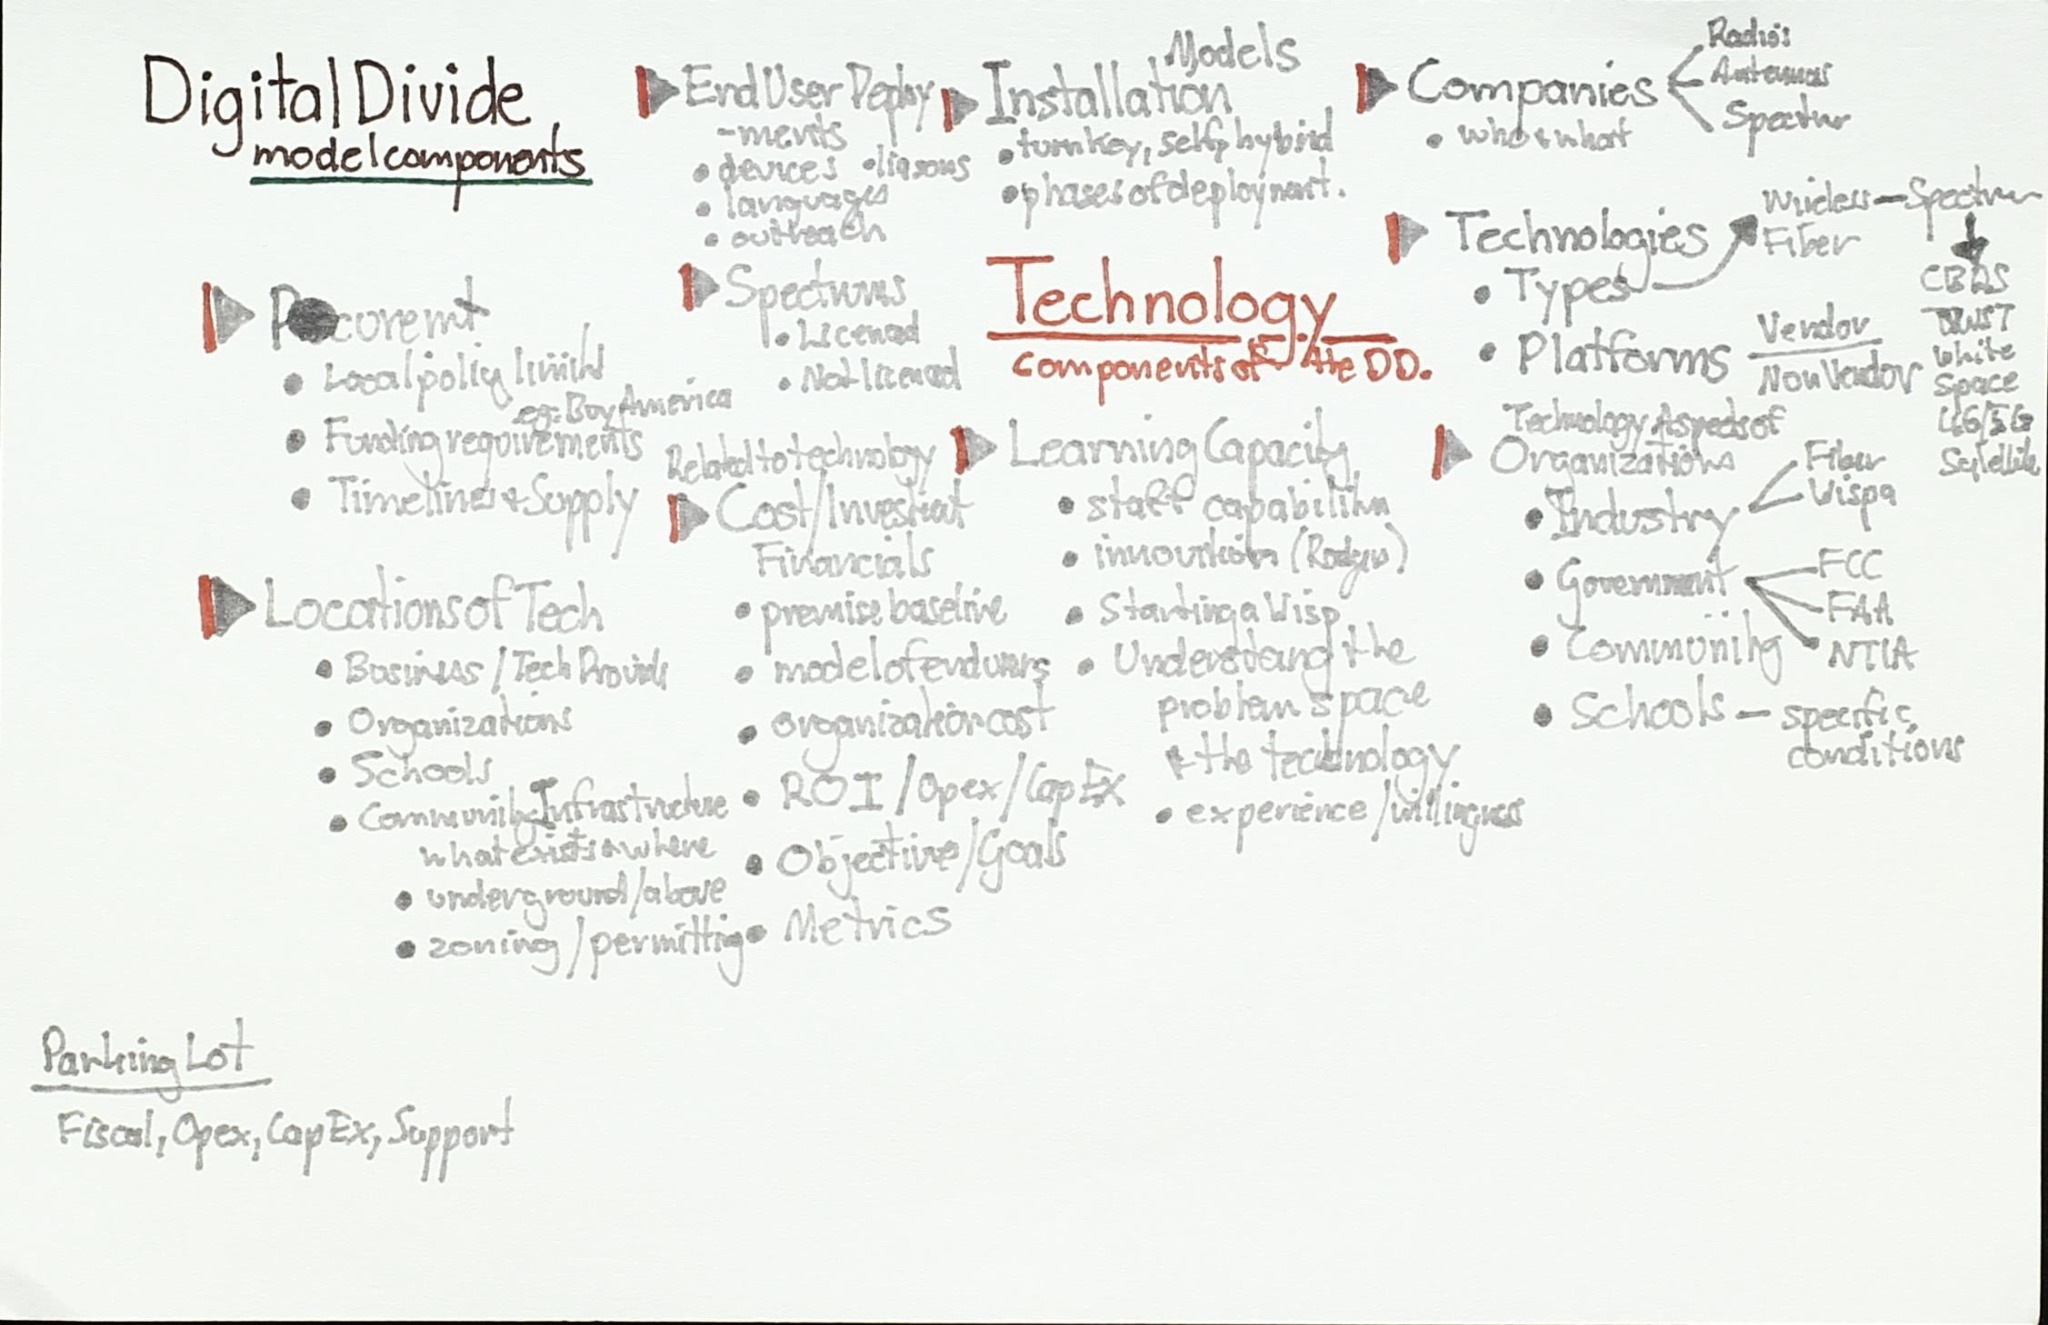
Faint digital-divide model overview connecting end users, institutions, companies, and technology
Model overview

End users, institutions, and technology

A concise overview linking user needs, institutional roles, commercial actors, technologies, and implementation considerations.

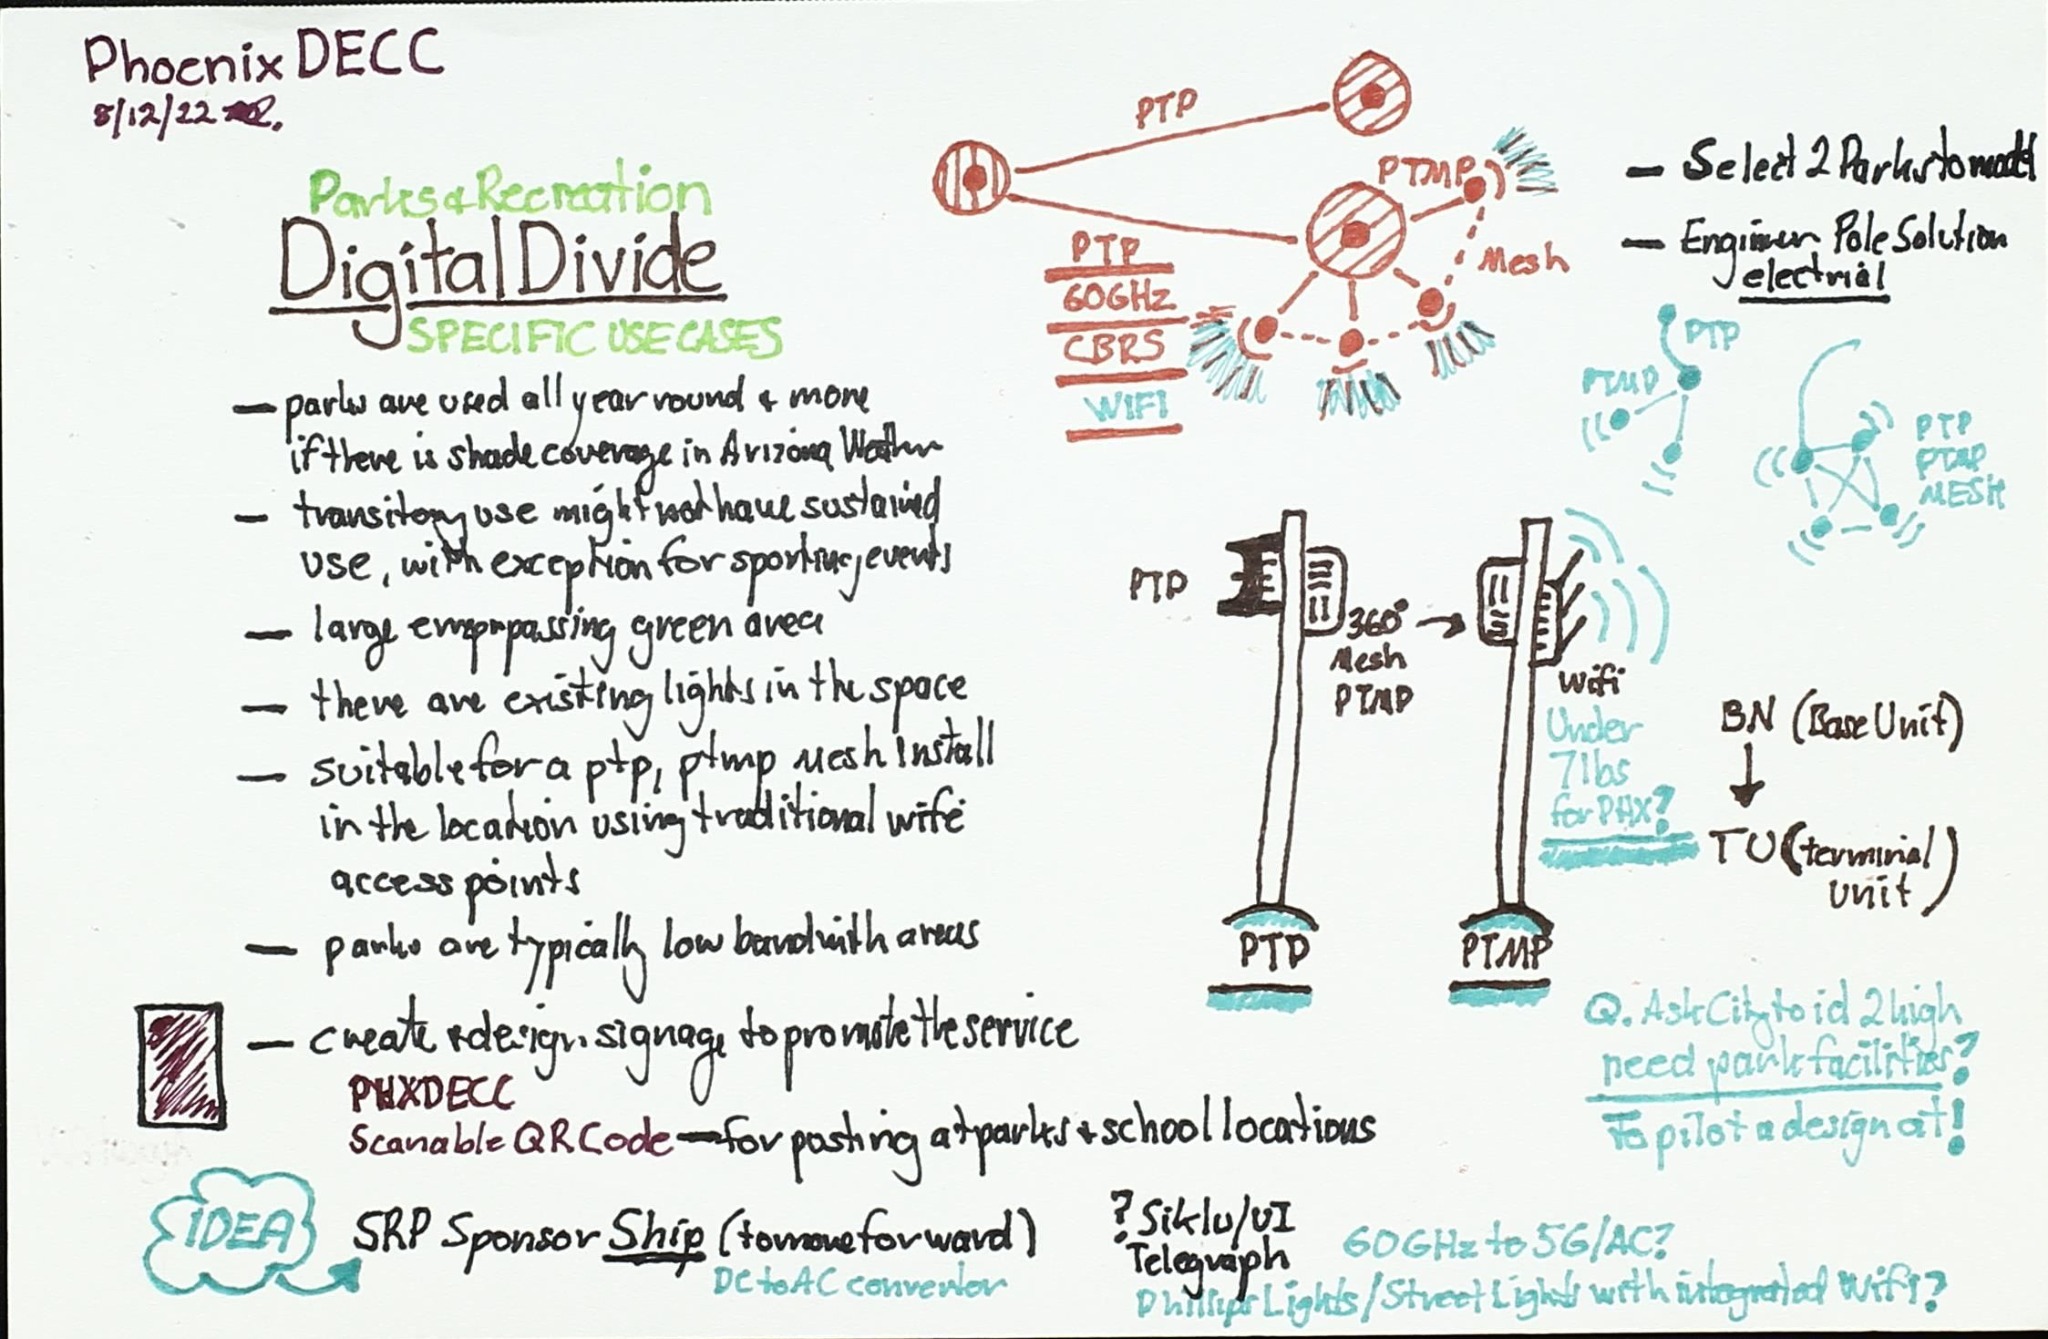
Phoenix DECC parks and recreation digital-divide use-case sketch with point-to-point and mesh network diagrams
Community use case

Parks and recreation connectivity

Explores public-space access through point-to-point, point-to-multipoint, mesh, Wi-Fi, and shared infrastructure options.

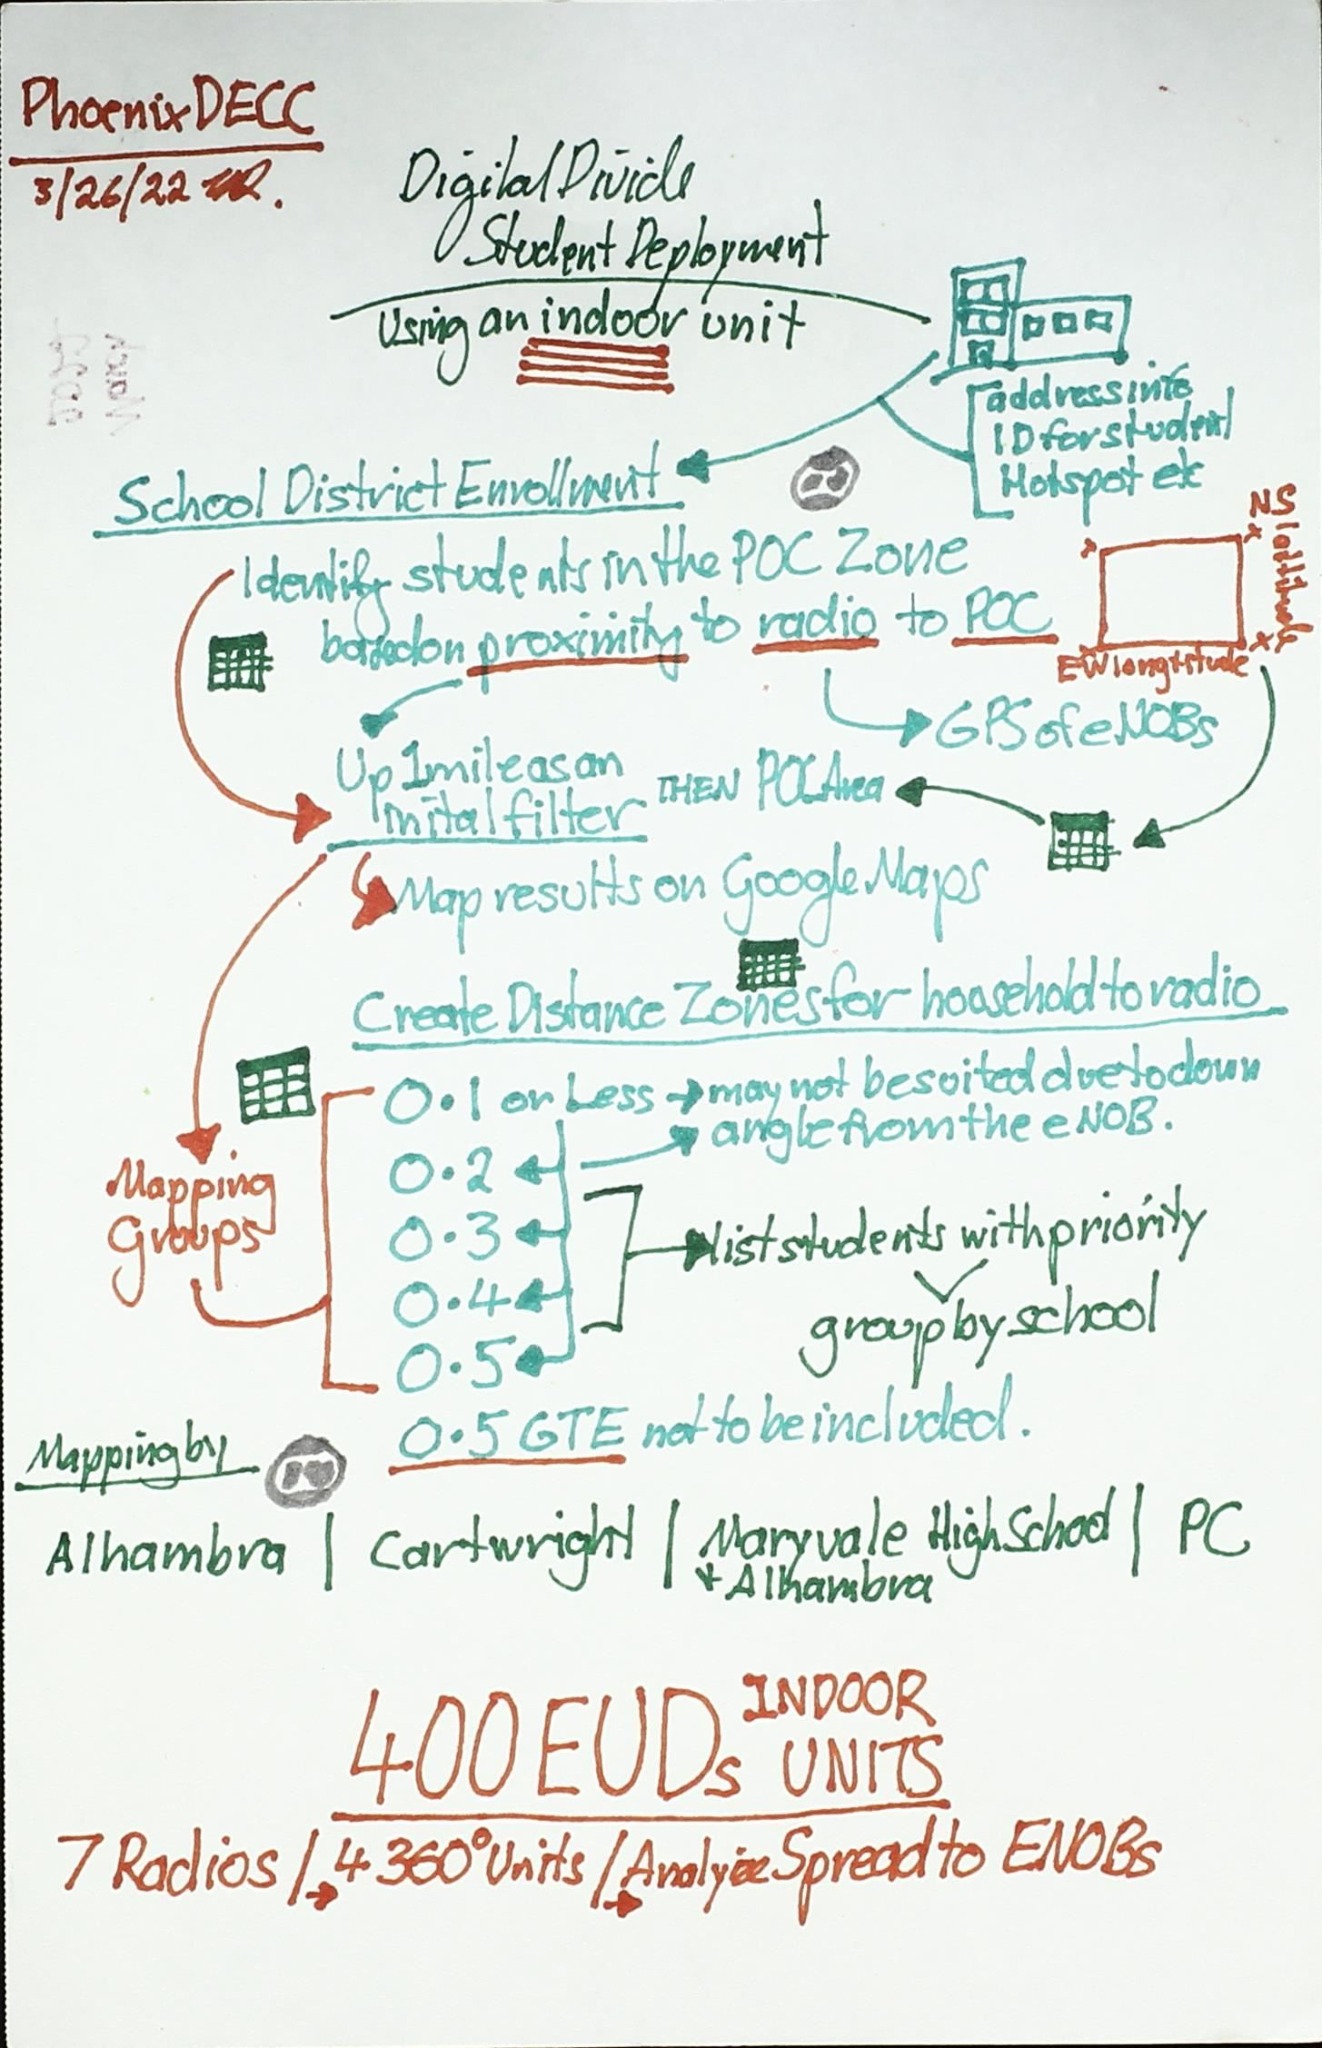
Phoenix DECC school-district enrollment and deployment sketch with indoor and outdoor equipment units
School deployment

Enrollment and service planning

Connects student enrollment, school locations, distance estimates, equipment types, and phased deployment decisions.

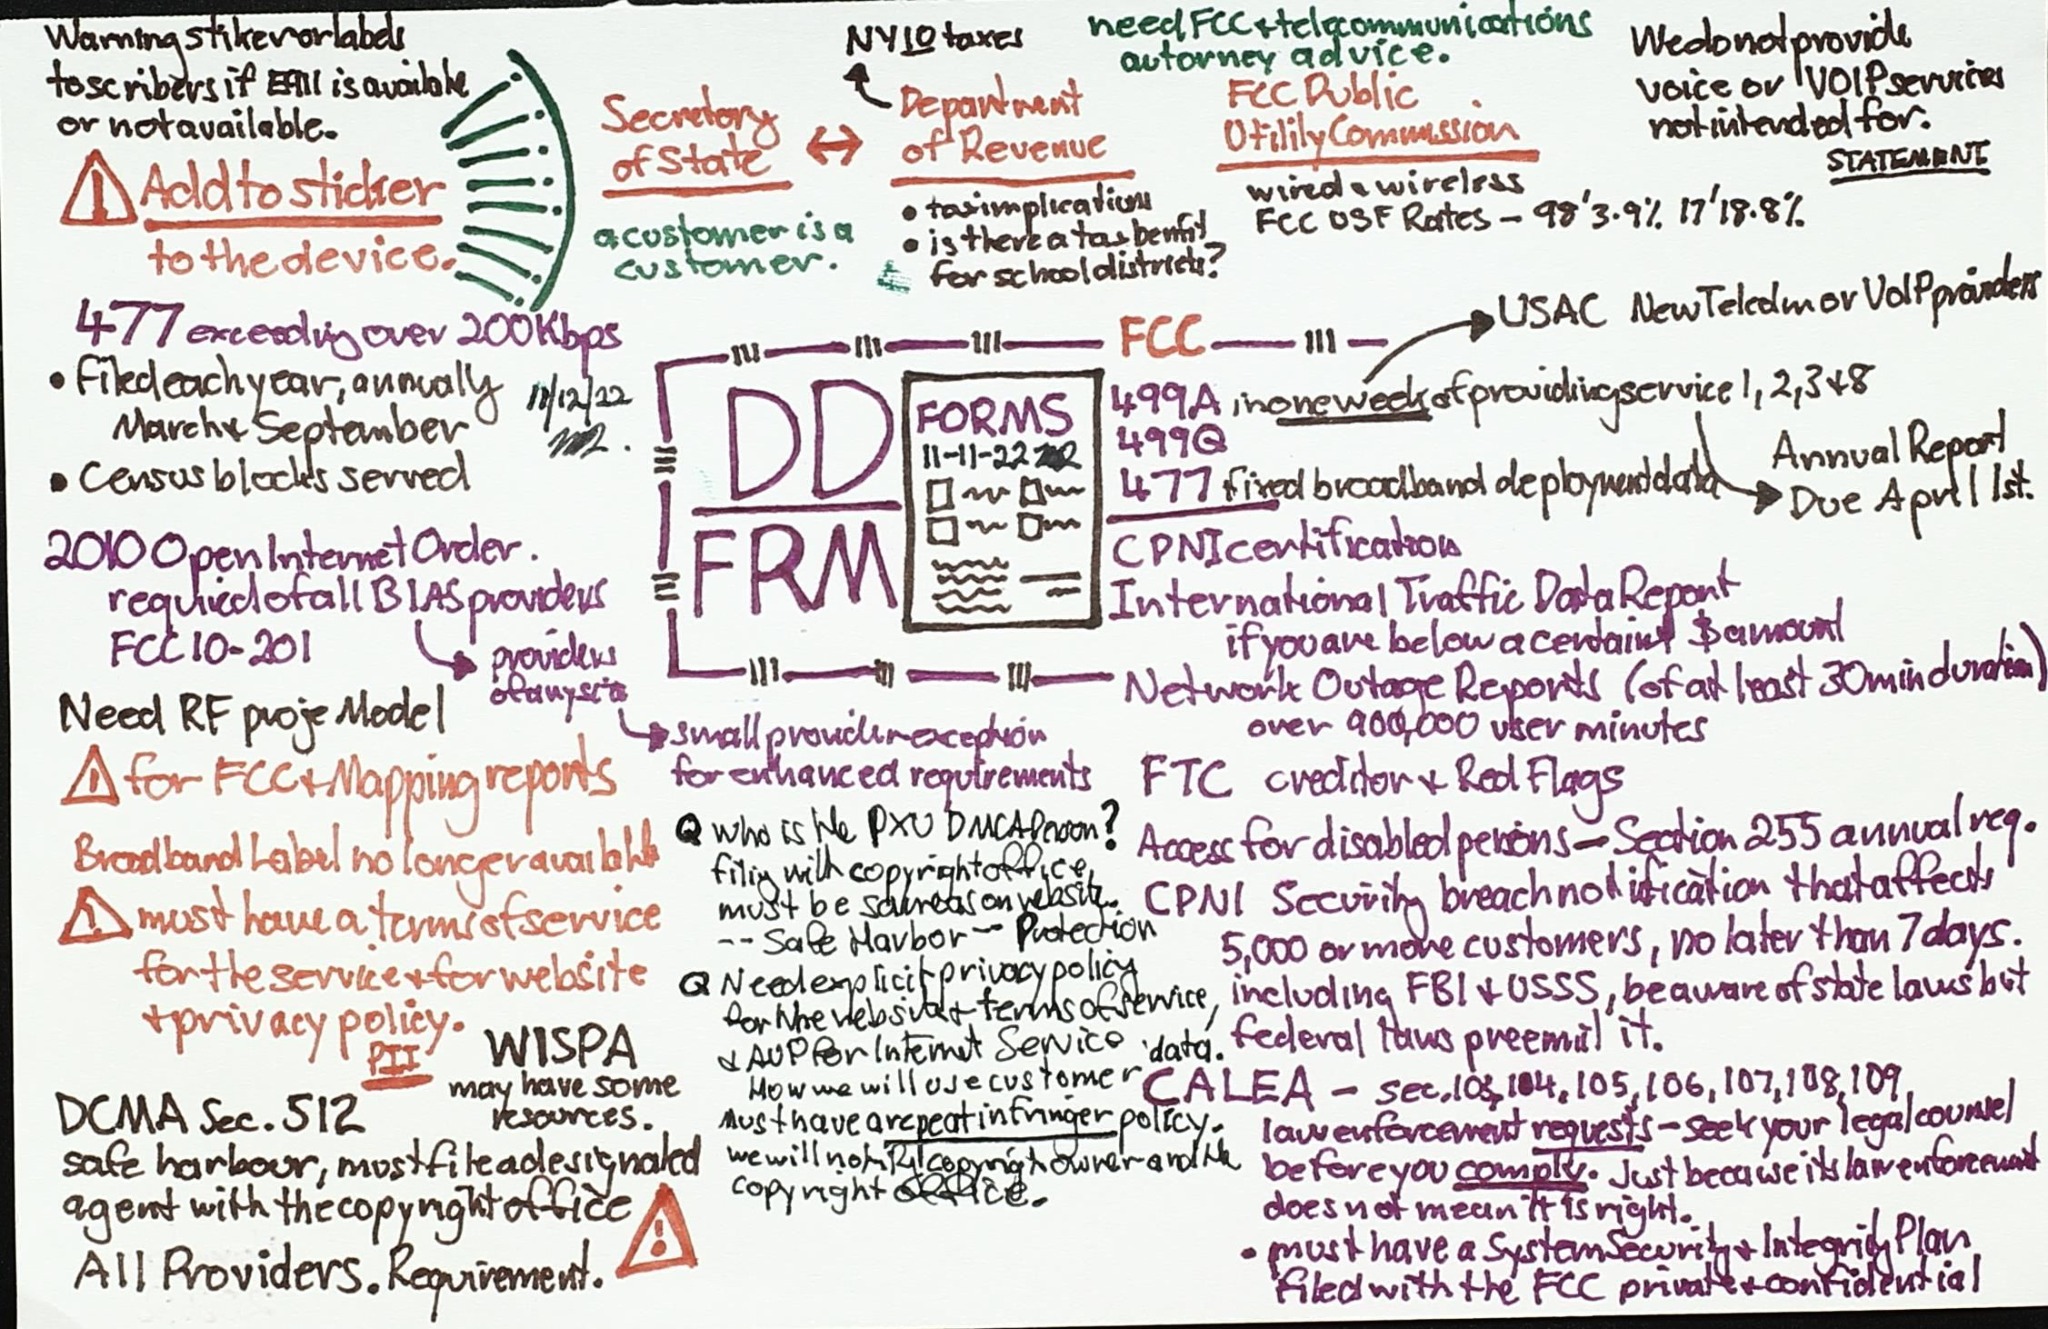
Digital Divide FRM regulatory and funding memo covering FCC, USAC, forms, providers, and program requirements
Policy mechanics

Funding and regulatory pathways

Organizes forms, agencies, service providers, reimbursement rules, program requirements, and compliance questions.

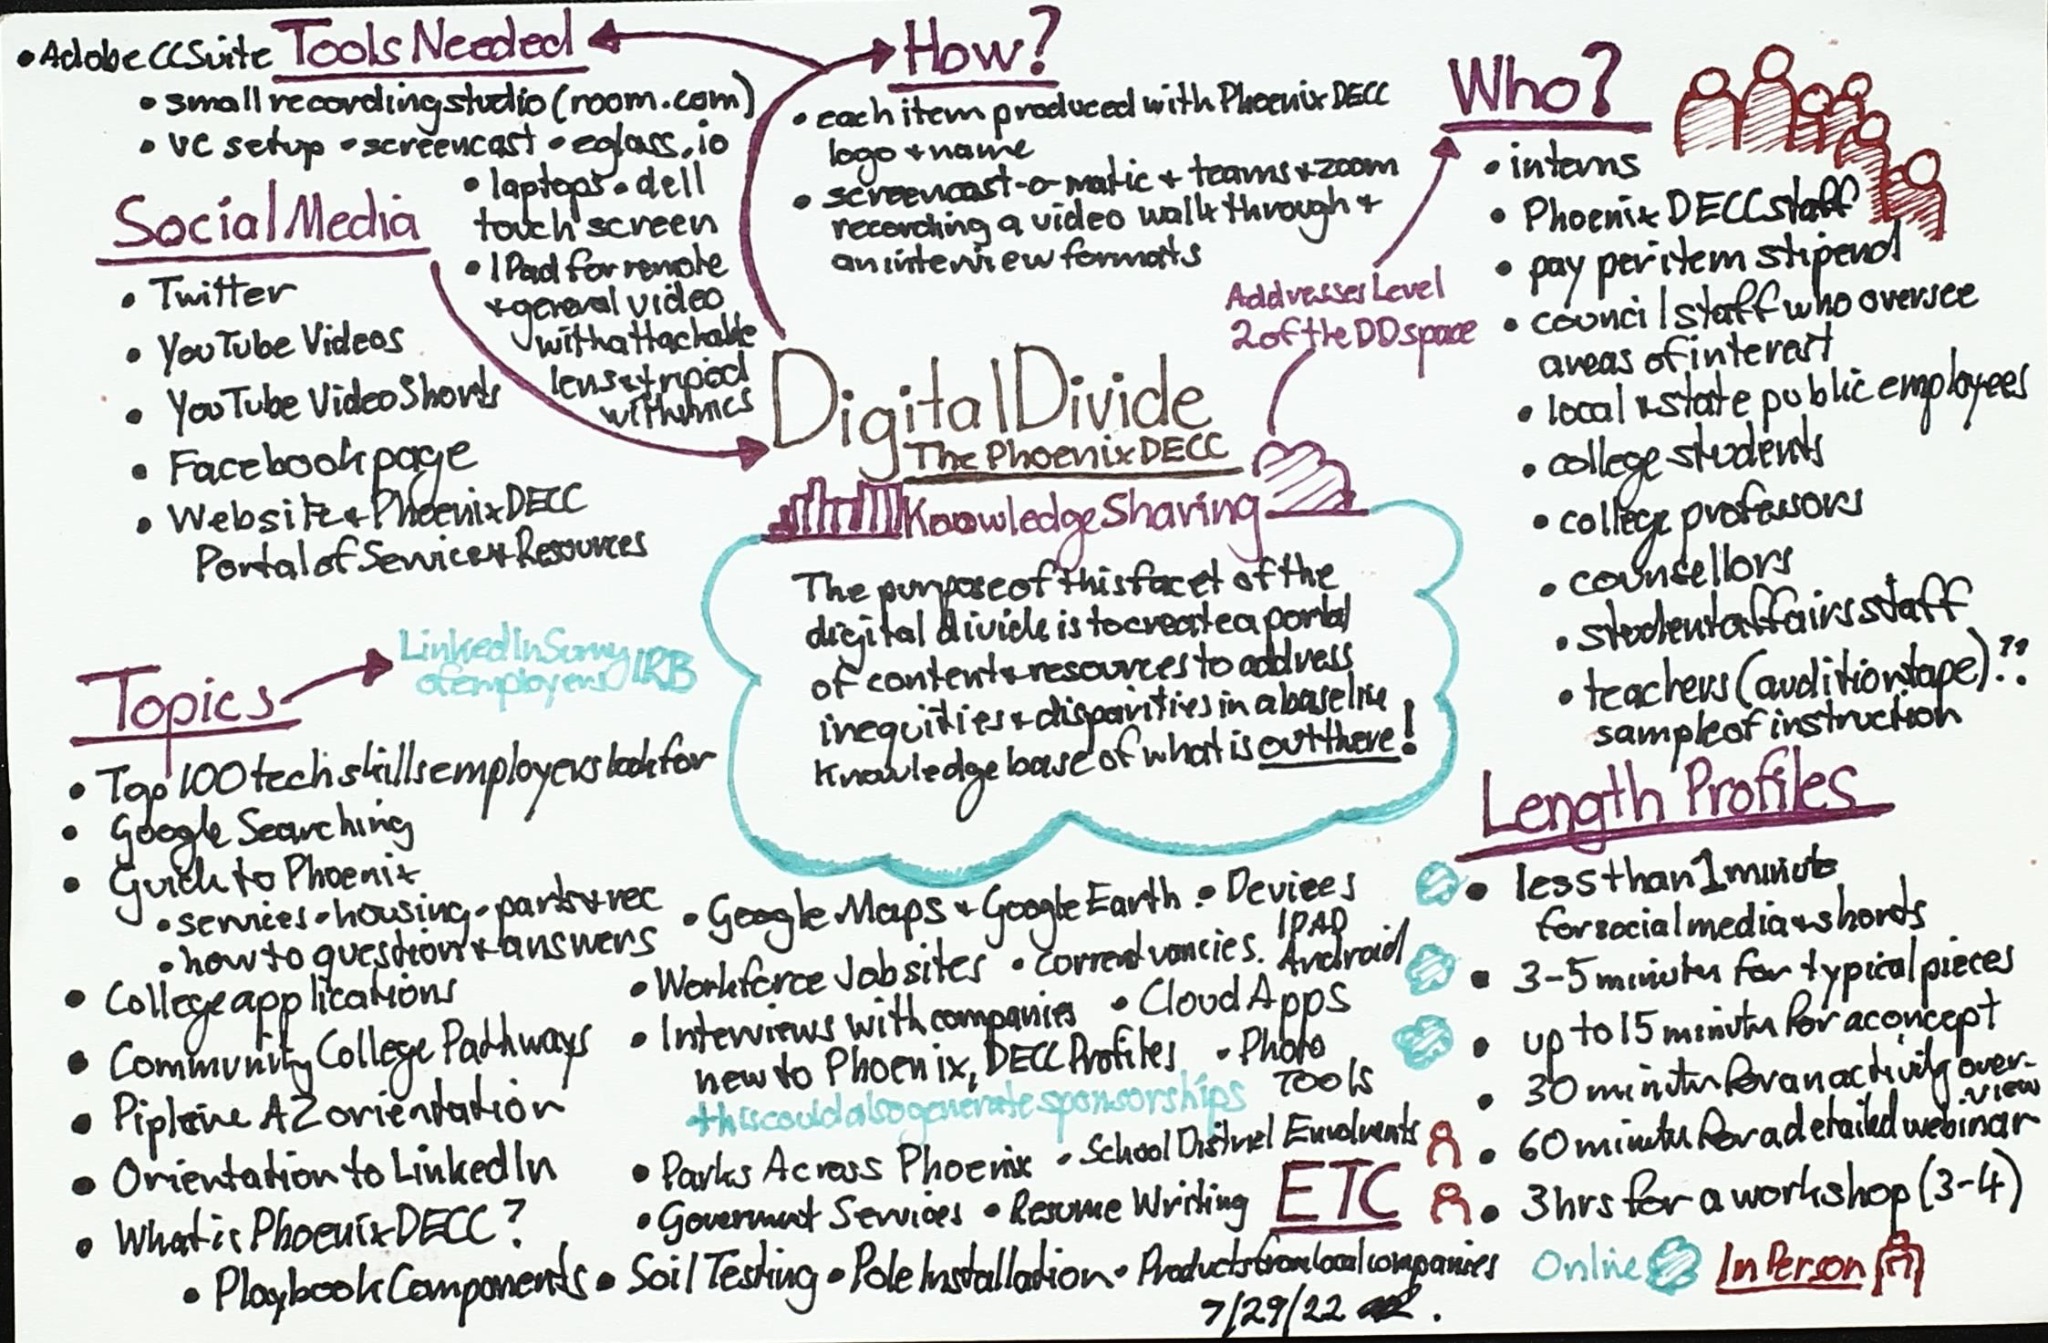
Phoenix DECC knowledge-sharing plan with social media, topics, audiences, tools, and profile lengths
Knowledge sharing

Turning research into resources

Maps audiences, communication channels, content formats, topic ideas, tools, and publication lengths for practical dissemination.

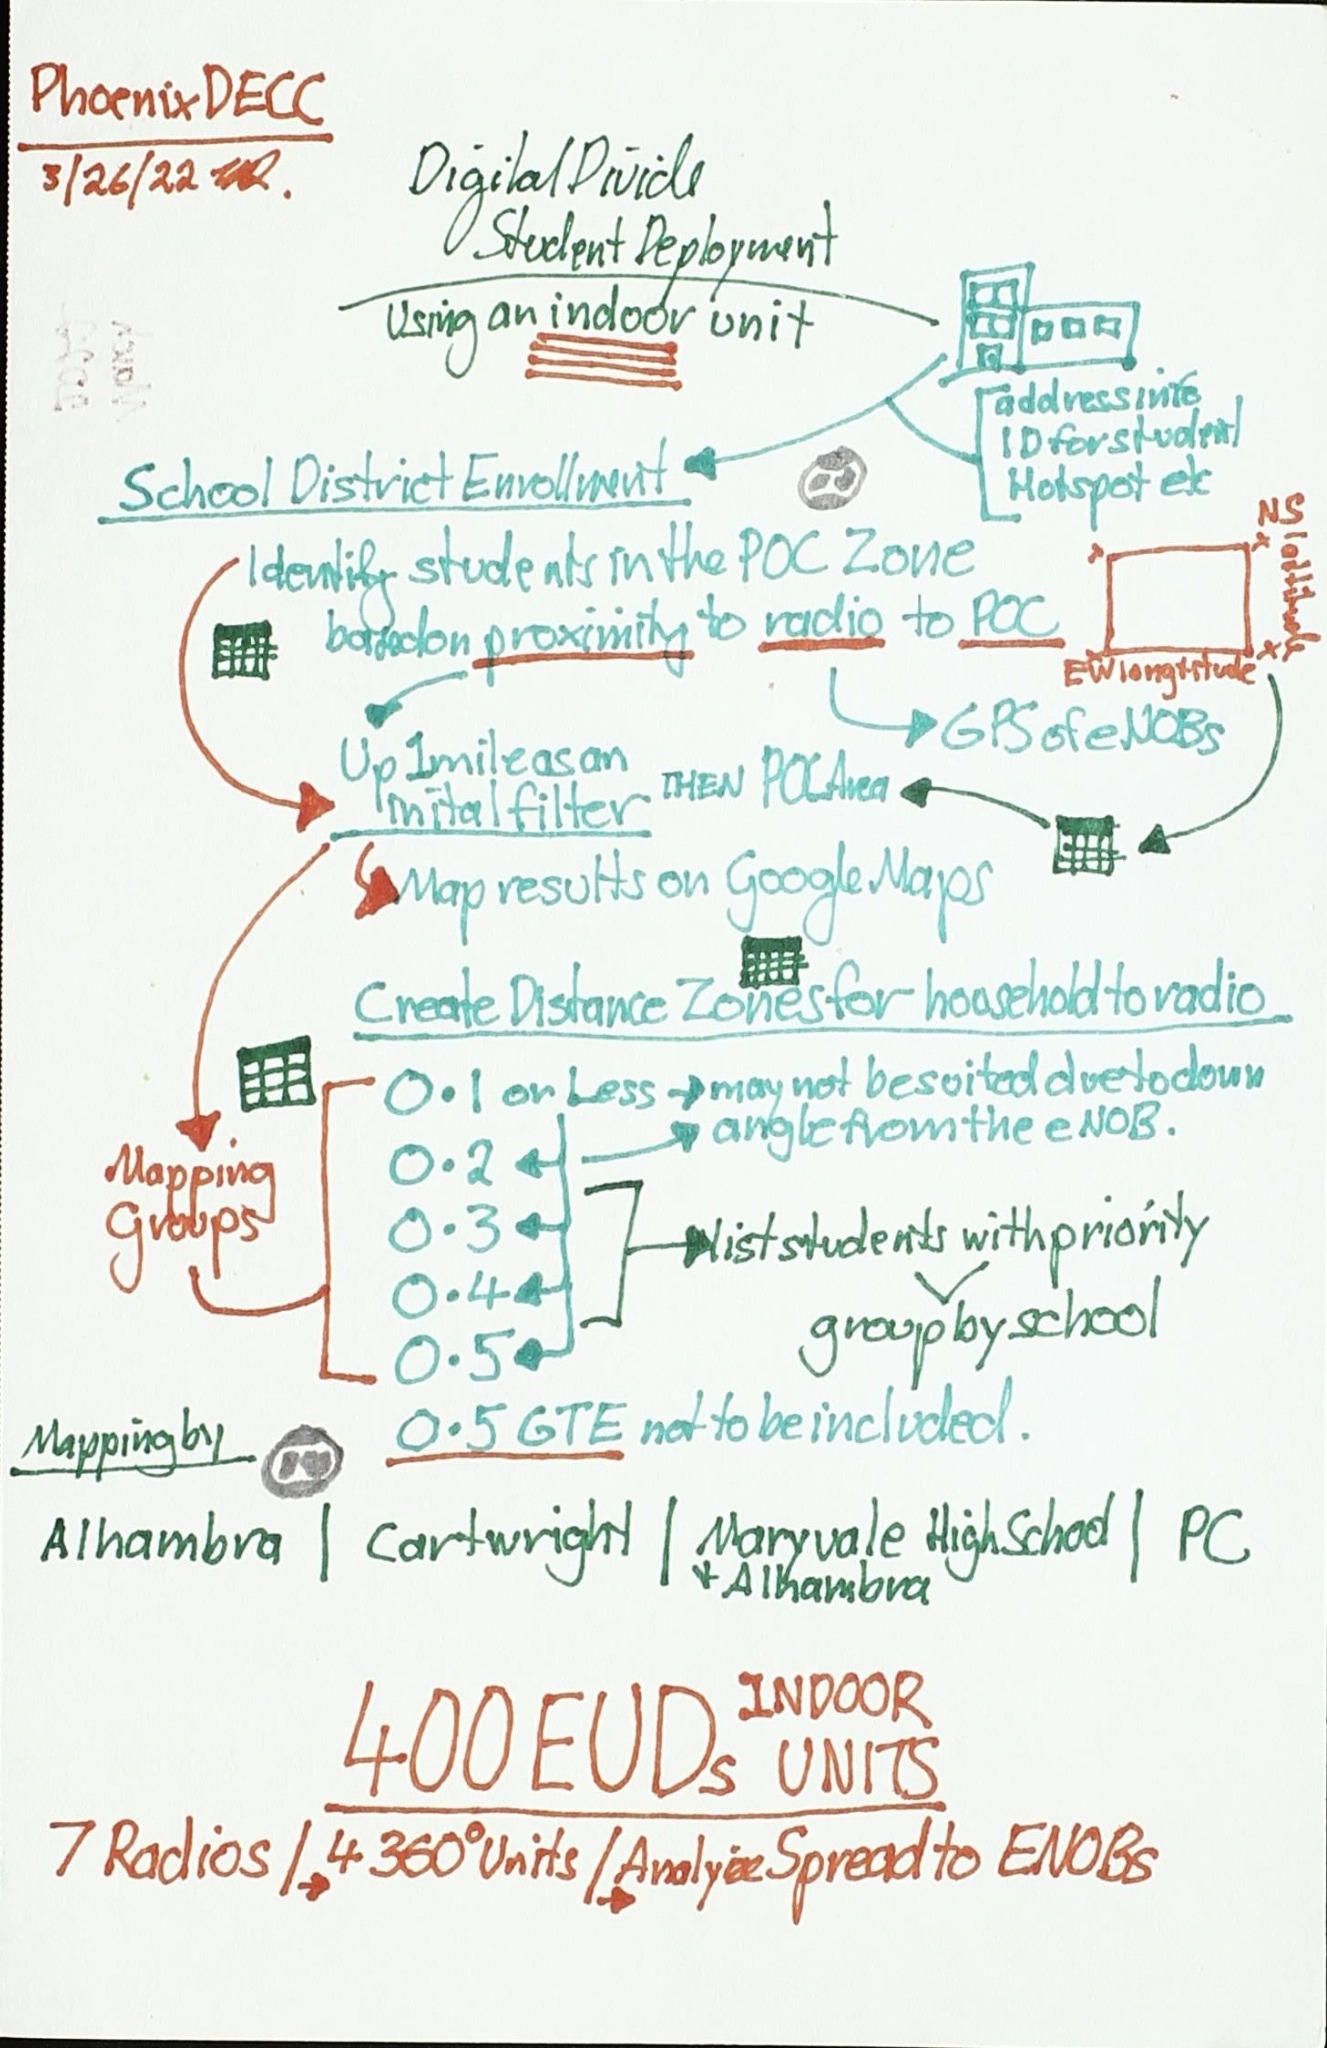
Phoenix DECC school-district deployment planning diagram with sites, coverage, distances, and equipment allocations
Network planning

School-site deployment detail

Refines the school connectivity scenario with distance bands, priority groups, site counts, coverage assumptions, and equipment allocations.

Role in the dissertation

What the memos contribute

Reflexive record

They preserve questions, assumptions, emerging relationships, and changes in emphasis across the inquiry.

Systems view

They keep technical, social, institutional, economic, and geographic dimensions visible at the same time.

Analytical bridge

They connect field experience and documentary evidence to later coding, comparison, category development, and theory construction.